 |
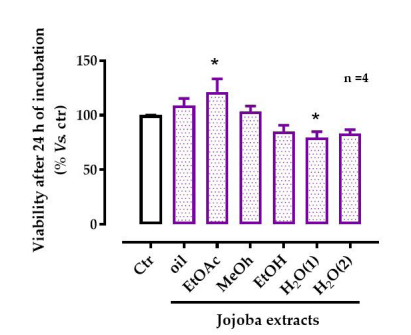
| Figure 1: Effect of jojoba extracts on viability of HepG2 cells All values are mean ± standard deviation (SD); *p < 0.05 compared to untreated cells; ctr, control |
|
| Figure 1: Effect of jojoba extracts on viability of HepG2 cells All values are mean ± standard deviation (SD); *p < 0.05 compared to untreated cells; ctr, control |
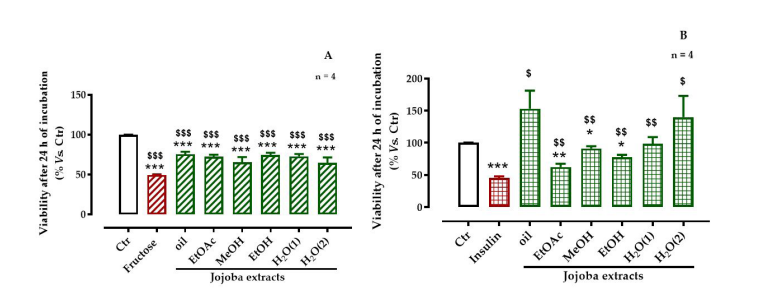 |
| Figure 2: Effect jojoba extracts on viability of HepG2 cells in the presence of (A) high-fructose or (B) high-insulin concentrations All values are means standard deviation (SD); * p < 0.05, ** p < 0.01, and *** p < 0.001 compared to untreated cells; $ p < 0.05, $$ p < 0.01, and $$$ p < 0.001 compared to fructose- or insulin-treated cells; ctr, control |
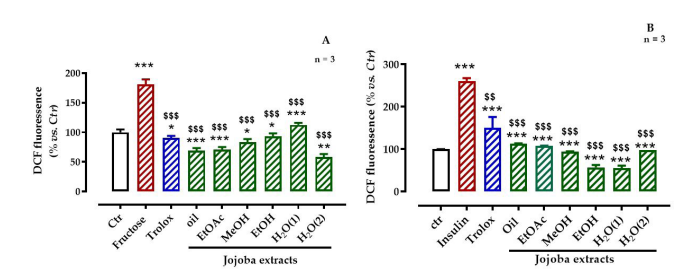 |
| Figure 3: Effect of jojoba extracts on (A) high-fructose- or (B) high-insulin-induced oxidative stress All values are means standard deviation (SD); * p < 0.05, ** p < 0.01, and *** p < 0.001 compared to untreated cells; $ p < 0.05, $$ p < 0.01, and $$$ p < 0.001 compared to fructose- or insulin-treated cells; ctr, control |
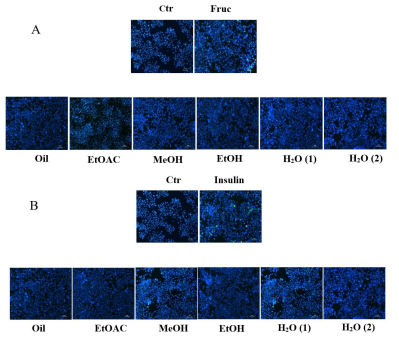 |
| Figure 4: Effect of jojoba extracts on (A) high-fructose- or (B) or high-insulin-induced apoptosis |
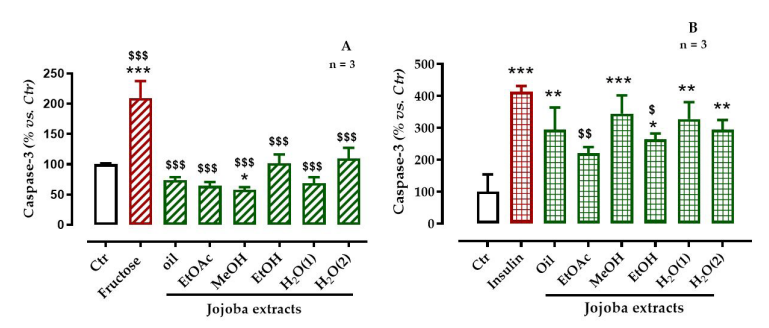 |
| Figure 5: Effect of jojoba extracts on caspase-3 activity of cells exposed to (A) high-fructose or (B) high-insulin All values are mean standard deviation (SD); * p < 0.05, ** p < 0.01, and *** p < 0.001 compared to untreated cells; $ p < 0.05, $$ p < 0.01, and $$$ p < 0.001 compared to fructose- or insulin-treated cells |
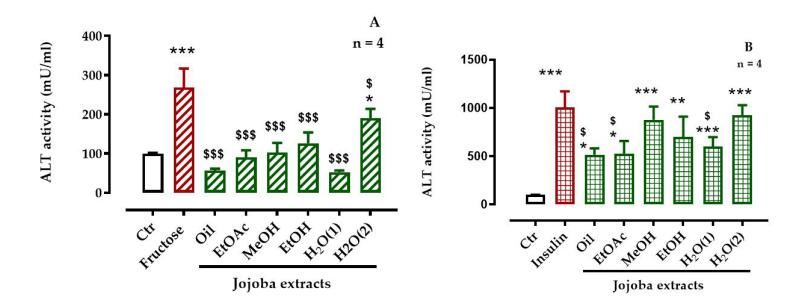 |
| Figure 6: Effect of jojoba extracts on alanine aminotransferase (ALT) activity in (A) high-fructose or (B) high-insulin treated cells |
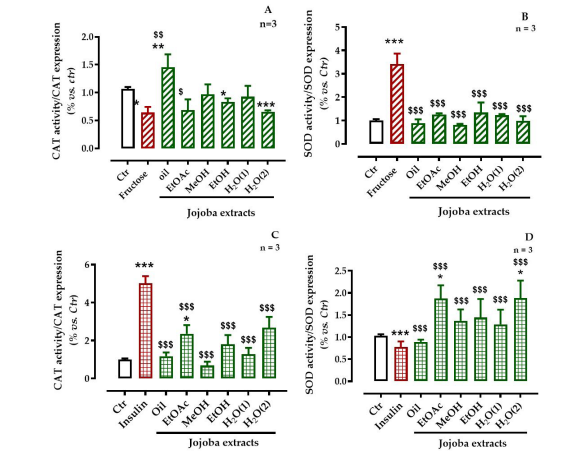 |
| Figure 7: Effect of jojoba extracts on antioxidant enzymes (superoxide dismutase [SOD] and catalase [CAT]) in high-fructose- or high-insulin-stressed cells All values are means standard deviation (SD); * p < 0.05, ** p < 0.01, and *** p < 0.001 compared to untreated cells; $ p < 0.05, $$ p < 0.01, and $$$ p < 0.001 compared to fructose-treated cells; ctr, control |
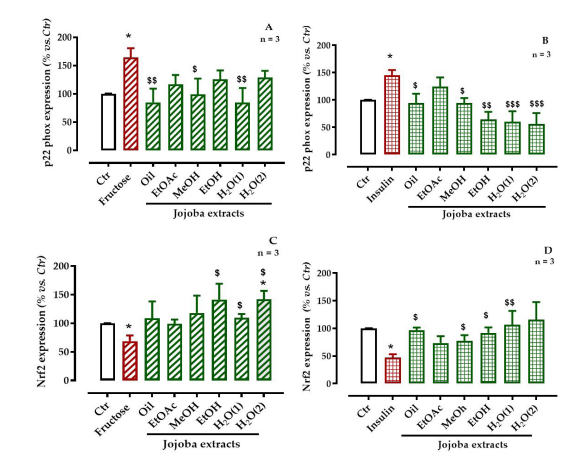 |
| Figure 8: Effect of jojoba extracts on pro-oxidant (p22-phox subunit of NADPH oxidase) and anti-oxidative (the nuclear factor, Nrf2) signaling pathways in high-fructose- or high-insulin-stressed cells All values are means standard deviation (SD); * p < 0.05, ** p < 0.01, and *** p < 0.001 compared to untreated cells; $ p < 0.05, $$ p < 0.01, and $$$ p < 0.001 compared to fructose-treated cells; ctr, control |
Acid group |
Fatty acid |
Retention time (min) |
Quantity (g/100g) |
Saturated fatty acids |
Octanoic acid |
1.90 |
0.02 |
Methanoic acid |
2.23 |
0.03 |
|
Tetradecanoic acid |
3.75 |
0.01 |
|
Hexadecanoic acid |
5.51 |
0.35 |
|
Octadecanoic acid |
8.26 |
0.01 |
|
Eicosanoic acid |
12.02 |
0.03 |
|
Docosanoic acid |
16.17 |
0.17 |
|
Monounsaturated fatty acids |
Palmitoleic acid |
5.78 |
0.10 |
Oleic acid |
8.71 |
3.63 |
|
Gadoleic acid |
12.68 |
17.60 |
|
Erucic acid |
16.80 |
3.35 |
|
Polyunsaturated fatty acids |
Linoleic acid |
9.46 |
0.04 |
α-Linolenic acid |
11.00 |
0.06 |
|
Nervonic acid |
21.84 |
0.02 |
|
Stearidonic acid |
11.63 |
0.27 |
|
Docosapentaenoic acid (DPA) |
20.55 |
0.50 |
|
Docosahexaenoic acid (DHA) |
21.17 |
0.29 |
|
NI |
15.95 |
10.26 |
|
NI |
20.45 |
9.22 |
Phenolic class |
Phenol name |
Retention |
% |
Hydroxybenzoic acid |
Syringic acid |
28 |
4.81 |
Gallic acid |
3.1 |
15.53 |
|
3',5'Dihydroxybenzoic acid |
3.7 |
1.55 |
|
p-Hydroxybenzoic acid |
21 |
1.24 |
|
Hydroxycinnamic acid |
Caffeoylquinic acid |
18.3 |
0.78 |
Caffeic hexoside acid |
23.7 |
1.55 |
|
p-Coumaric acid |
34.2 |
5.74 |
|
Ferulic acid |
39.5 |
2.33 |
|
Sinapic acid |
42.5 |
1.55 |
|
Anthocyanin |
Cyanidine-3-rutinoside |
29.2 |
5.43 |
Flavonoid |
Catechin (+) |
24.4 |
4.50 |
Kaempferol 3-glucoside |
28.7 |
0.93 |
|
Apigenin 7-rutinoside |
29.6 |
1.242 |
|
Quercetin 3',4'-diglucoside |
31.88 |
1.24 |
|
Rutin |
38.15 |
9.94 |
|
Epicatechin gallate |
45.47 |
22.05 |
|
Quercetin |
58.5 |
3.89 |
|
Isorhamnetine-3-glucoside |
59.5 |
8.38 |
|
|
NI |
22.1 |
0.93 |
|
NI |
33.1 |
0.93 |
|
NI |
36.6 |
0.78 |
|
NI |
61 |
4.66 |