Open Access
Research Article
Max Screen
ISSN: 2393-9060
Copyright: © Sahla Belhadj. This is an open-access article distributed under the terms of the Creative Commons Attribution License, which permits unrestricted use, distribution, and reproduction in any medium, provided the original author and source are credited.
Related article at Pubmed, Google Scholar
Acute hyperglycemia (HG) and hyperinsulinemia (HI) induce oxidative stress (OS) in the liver and lead to systemic inflammation in type 2 diabetes. The aim of our study was to comparatively evaluate the antioxidant properties of different jojoba seed extracts (JSE) on fructose- and insulin induced oxidative stress in human hepatocyte cell line HepG2. This study showed that HG or HI induced a loss of hepatocyte viability, increased cell apoptosis and lysis associated with increased reactive oxygen species (ROS) production and modulated the pro- and antioxidant status. Conversely, treatment with JSE significantly improved the hepatocyte viability, limited the apoptosis and cell lysis, and decreased ROS production. Amelioration was also depicted for the antioxidant activity with an overexpression of catalase (CAT) and superoxide dismutase (SOD). Most importantly, JSE attenuated hydrogen peroxide (H2 O2 )-induced oxidative damage and apoptosis of HepG2 cells by inhibiting the nicotinamide adenine dinucleotide phosphate (NADP)-oxidase p22-phox subunit and activating the erythroid 2 like 2 (Nrf2) nuclear factor, signal pathways. In conclusion, the JSE modulated the antioxidant signalling pathway after HG- or HI-induced OS in hepatocytes and were effective regardless of the adopted extraction condition. These results suggest that a combination of several molecules is responsible for the antioxidant properties and not a pure extract component.
Keywords: Jojoba Seed Extracts; Diabetes; ADP-Oxidase p22-Phox Subunit; Hepg2 Cell Line; Nrf2 Nuclear Factor; Oxidative Stress
Diabetes mellitus is a metabolic disorder that affects approximately 383 million adults, is projected to reach 592 million in 2035. Diabetes is a disease that affects the body’s ability to produce or use insulin. When the secretion or action of insulin is deteriorated, glucose blood levels increase, which induces hyperglycemia (HG). Currently, HG is known to be closely related to OS. Furthermore, HG is an important factor in the development of diabetes complications that acts through different mechanisms such as the activation of protein kinase C, polyol, and hexosamine pathways, as well as advanced glycation end products [1]. These pathways in association with HG-induced mitochondrial dysfunction and endoplasmic reticulum stress, promote oxygen species (ROS) accumulation, which in turn, promotes cellular damage and contributes to the development and progression of diabetes complications.
Previous studies have demonstrated that OS plays a central role in the disease onset and the development of many related complications [2]. In diabetes, insulin resistance is the primary cause of hyperinsulinemia (HI), and the pancreas compensates by producing more insulin. Hyperinsulinism also weakens the antioxidant defences of the body and stimulates the production of oxidizing molecules. Insulin stimulates the production of hydrogen peroxide (H2 O2 ), thereby accelerating the production of hydroxyl radical through the Haber-Weiss reaction [3]
OS is defined as an imbalance between the production of ROS and the antioxidant molecules in favour of oxidant activities [4]. When the body fails to adapt to the elevation of ROS by endogenous antioxidant system, ROS accumulate and activate the stress signaling pathways, thereby causing cell damage [5]. This activation involves nicotinamide adenine dinucleotide phosphate (NADPH)-oxidase and, more particularly, the NADPH-oxidase p22phox subunit. The expression of p22phox is regulated by a redox-sensitive pathway.
NADPH-oxidase uses an electron donor, NADPH or NADH, to reduce the atom oxygen under OS conditions to produce the superoxide anion, which is a ROS [6].
An increase in Deoxyribonucleic acid alterations has been shown in the immune cells of patients with type 2 Diabetes (T2D) and markers of OS such as H2 O2 regress following intensive treatment of HG [7]. Notably, Nuclear factor (erythroid-derived 2)-like 2 (Nrf2) is a major regulator of cellular redox balance [8].
Furthermore, the liver has an important role in carbohydrate metabolism since it is responsible for balancing blood glucose levels by glycogenesis and glycogenolysis. Moreover, the liver is the major organ exposed to ROS [9] and the production of large amounts disrupts homeostasis, leading to OS that plays an essential role in degenerative and chronic disorders and liver diseases [10,11].
Drug therapies have been used for the treatment of liver diseases, but they have some side effects [12]. To balance the oxidative state, the body maintains complex systems of overlapping antioxidants such as glutathione (GSH), catalase (CAT) and superoxide dismutase (SOD) produced endogenously or from dietary sources. Antioxidants from medicinal plants are widely used to protect against OS, and several plants are rich in antioxidant molecules such as flavonoids, alkaloids, phenolic compounds, tannins, terpenoids [13].
Jojoba (Simmondsia chinensis) belongs to the family Simmondsiaceae. Jojoba seed (JS) produces 50% of its dry weight in a colorless, odorless liquid oil [14]. The remainder of the protein-rich seed (32%) [15] and glycosides (15%) [16] are used for animal feed [17]. It contains considerable amounts of tannins (2.5%) [18], anthocyanins and alkaloids [19]. In a recent study [20], extraction of JS by distilled water showed different classes of polyphenols such as hydroxybenzoic acid, flavonoids, anthocyanins and hydroxycinnamic acids. For the first time, this study showed hypoglycemic and antioxidant effects of simmondsin and aqueous extract on RIN m5f cells. In another recent in vivo study [21], it has demonstrated the protective effects of JS in a metabolic syndrome rat model on plasma and tissues (pancreas, kidneys and liver). Addition of JS in the diet decreased OS and increased Total Antioxidant Capacity. Depending on the polarity of the solvents and their physicochemical properties [22], several extractions can be carried out to determine the maximum of molecules present in the plant to be studied as well as their characteristics [23]. Therefore, the present study aimed to compare the antioxidant effect of JSE on HepG2 cell line under HG and HI-OS.
The seeds were collected in July 2013 from Meknassy, Sidi Bouzid, Tunisia (latitude: 34°6333, longitude: 9°61667, altitude), and were authenticated by the agricultural engineer Fakhreddine Khaskhoussi working in the jojoba fields.
Briefly, 200 g of the dried seeds was ground and extracted sequentially by maceration (24 h × 3) in 3 × 600 mL of hexane each to extract the oil, ethyl acetate (EtOAc), and methanol (MeOH). A separate extraction was performed with 3 × 600 mL of ethanol to obtain the EtOH extract. Two independent water extractions were done. The first was in water at 37 °C, followed by concentration of the extract under vacuum at 50 °C to obtain the H2 O(1) extract. Another extraction with H2 O was performed according to Bellirou et al., (2005) [24] to yield the H2 O(2) extract. Finally, the solvents were evaporated, and the extracts obtained were conserved for experiments.
The analysis of fatty acids by GC requires their conversion to more volatile compounds such as methyl esters [25](Cecchi et al., 1985).
The GC fatty acids analysis was carried out using HP 6890 series equipment with a flame ionization detector (FID) and an electronic pressure control injector. The capillary column was HP Innowax type coated with polyethylene glycol (stationary phase). Its internal diameter was 250 μm, while the film length and thickness were 30 m and 0.25 μm, respectively. The analyses were carried out under the following conditions: vector gas, nitrogen U; total flow rate, 1.6 mL/min; injector mode, split; split ratio, 60:1; injector and detector temperatures, increased to 250 and 275 °C, respectively
The oven temperature program was as follows: isotherm, 120 °C for 1 min, 15 °C/min up to 200 °C, 200 °C for 3 min, and increments from 2 °C/min to 242 °C. The peak areas and percentages of fatty acids were determined using the HP-Chemstation software (Rev. A.0401) to control the chromatograph. The fatty acids were identified by comparing their chromatograms with those of pure control standards analyzed under the same conditions. The internal standard (C19: 0) was added at a known amount during methylation to enable the determination of the various fatty acid contents.
The RP-HPLC was carried out using the Dionex Ultimate 3000 analytical device. It was provided equipped with an ultraviolet-visible detector (barrier detector of Diodes 3000 RS) and with an ACE C18-PFP column (250 × 4.6 mm, 5-μm). The separation and analysis of phenolic compounds isolated from the jojoba aqueous extract was performed at room temperature and a maintained flow rate of 1 mL/min. The mobile phase consisted of H2 O with 0.1 % formic acid (solvent A) and acetonitrile (solvent B). The program gradient was: 97% A/3% B 0 – 35 min, 79.5% A/20.5% B 35–45 min, and 72% 97% A/3% B 66 – 76 min. The injection volume was 20 μL, and the chromatographic profiles were examined at 280 nm. The peaks of the phenolic compounds were identified according to their retention time by co-injection with pure phenolic acid and flavonoid controls under the same experimental conditions.
The HepG2 cell line (ATCC® HB8065 ™) was cultured in Dulbecco’s modified Eagle’s medium (DMEM/F12 (1×) supplemented with 10 % of fetal bovine serum (FBS, Sigma-Aldrich, USA), 1% of antibiotic-antimycotic (ABAM, Thermo Fisher Scientific, France) and 1% of 4-(2-hydroxyethyl)-1-piperazine ethane sulfonic (HEPES, Fisher Scientific). When the cells were in the pre-confluence phase (80%), they were detached using 0.05% of trypsin-ethylenediaminetetraacetic acid (EDTA, Sigma-Aldrich). For routine cultures, the medium was changed every 48 h.
HepG2 cells were grown in DMEM/F12 (1×) medium supplemented with 10% FBS in a humidified atmosphere of 5 % CO2 at 37 °C. At 80% confluence, the cells were seeded either in a 96-well plate to carry out the viability and ROS production test or a six-well plate for the other tests at 5 × 10⁴ and 106 cells/well densities, respectively. The cells were serum-starved 12 h before starting the treatments. To mimic HG or HI conditions, the cells were incubated with 250 mM fructose (Sigma-Aldrich) or 7 UI/ml insulin (Umuline NPH, Eli-Lilly, Paris, France) for 24 h. Then, to evaluate the effect of plant extracts under high concentrations of fructose or insulin, cells were also incubated with 150 µg/ml of each extract for 24 h.
The cell viability was evaluated using the 3-(4,5-dimethylthiazol-2-yl)-2,5-diphenyl tetrazolium bromide (MTT) test. This is a colorimetric method based on the reduction of MTT using the Aqueous One Solution cell proliferation assay (Promega, USA). After incubating the cells for 2 h at 37 °C with Cell Titer 96® in an atmosphere of 5% CO2 , the absorbance was measured at 490 nm using a Meterech 960 microplate reader (Metertech Inc., Taiwan). The results were expressed as a percentage (%) relative to untreated cells. For measuring cell viability in real-time, the non-chemical, homogeneous, bioluminescent method was adopted using the MT RealTime-Glo™ (Promega, USA). This test determines the number of viable cells in cultures by measuring the cell reduction potential and, thus, the metabolism (MT). The results were expressed as a percentage of untreated cell values.s
To evaluate the ROS production, the dichloro-dihydro-fluorescein diacetate (DCFH-DA) assay (Thermo Fisher Scientific, France) was used as a quantitative method for OS assessment according to the manufacturer’s instructions. To perform the assay, cells were seeded in 96-well black microplates (Greiner Bio-One) and cultured for 48 h at 37 °C under an atmosphere of 5 % CO2 . After that period the cells were incubated with DCFH-DA which kinetic fluorescence was followed (excitation and emission wavelengths: 485 and 538 nm, respectively) by measuring every 10 min for 100 min. The cellular antioxidant activity was calculated by integrating the area under the kinetic curve using the following equation:
The blank represents the negative control cells incubated with DCFH-DA without any induced OS. The control corresponds to cells subjected to OS with DCFH-DA. The positive control consists of cells subjected to OS with the DCFH-DA and then treated with 6-hydroxy-2,5,7,8-tetramethylchroman-2-carboxylic acid (Trolox). The results were expressed as a percentage of untreated cell values.
Apoptosis was detected using ApopTag® fluorescein in Situ kit (Merk Millipore, France). The cells were seeded in a 6-well plate and treated with JSE. The nuclear morphology of the cells was examined using fluorescent microscope (NIS-Element BR, Nikon, France).
HepG2 cells were treated as described above and the cytosolic enzymatic activity of caspase-3 was measured using a Quantikine® ELISA caspase-3 kit (Thermo Fisher Scientific) according to the manufacturer’s instructions. The caspase-3 activity in the cell lysates was measured using a colorimetric plate reader and was normalized to the cellular protein concentration. The results were expressed as a percentage (%) relative to the values of untreated cells
HepG2 cells (1 × 10⁶ cells/well) were grown in six-well plates for 48 h. The ALT activity was evaluated using the Abcam kit and according to the manufacturer’s instructions. The ALT level was expressed as a percentage (%) relative to the values of untreated cells
HepG2 cells were cultured in six-well plates and incubated with the different treatments, followed by the protein extractions using 200 μL mammalian lysis buffer (N-PERTM, Thermo Scientific) supplemented with 10 μL of protease inhibitors cocktail (Roche Diagnostics, Meylan, France). The cell lysate was recovered, incubated for 30 min on ice, shaken every 10 min on vortex, and then centrifuged at 10,000 g for 10 min at 4 °C.
To measure the SOD and CAT activities, colorimetric kit assay (Abcam, France) and fluorimetric kit assay (Abcam) were used according to the manufacturer’s instructions, respectively. The assay results were expressed in units of enzymatic activity per milligram of proteins (U/mg prot).
At the end of the treatments, the cells were rinsed with 500 µL PBS and lysed with mammalian buffer (N-PERTM, Thermo Fisher Scientific) (200 µL) and 10 µL of a protease inhibitor cocktail (Roche Diagnostics, France). For the western blotting, 20 µg of proteins were separated on a 4–12% Bis-Tris CriterionTM XT precast gel (Bio-Rad, France) and transferred to polyvinylidene fluoride (PVDF) membrane (Millipore, France). Membranes were blocked with 5% (w/v) bovine serum albumin (BSA) in 0.1% (v/v) PBSTween-20 (TPBS), washed in TPBS, and incubated overnight at 4 °C with anti-p22 phox (1:500, Santa Cruz Biotechnology, USA), anti-Nrf2 (1:500, Santa Cruz Biotechnology), anti-MnSOD (1:1000, Sigma-Aldrich, France), and anti-CAT (1:1000, Sigma-Aldrich) antibodies
The membranes were then incubated with a secondary horseradish peroxidase-conjugated antibody. Raw quantification of proteins was performed by comparison with β-actin (Santa Cruz Biotechnology), a reference protein, using the ImageJ software. The results were expressed as a percentage (%) relative to the values of untreated cells presented as a ratio (activity/expression).
Statistical analysis was performed by one-way analysis of variance (ANOVA) and by Fischer’s test using the Statistica software (StatSoft, Tulsa, OK, USA).
All data were given as mean ± standard error of the mean (SEM). Differences were considered statistically significant at p < 0.05 (*, $), p < 0.01 (**, $$), or p < 0.001 (***, $$$).
The chemical composition of the jojoba oil (Table 1) and EtOAc extract (Supplementary data, Table S1 and Fig. S1) was determined using GC analysis. Results showed that the jojoba oil extract consisted mainly in monounsaturated fatty acids MUFAs (24.7 g/100 g JS) while the EtOAc extract mainly contained saturated (6.9 g/100 g JS) and polyunsaturated fatty acids PUFAs (3.7 g/100 g JS). These latter were represented by omega-3 fatty acids such as docosapentaenoic acid and docosahexaenoic acid, and the omega-6 fatty acids.
Based on the compounds identified by the GC, the major oil fatty acids extract were MUFAs represented by gadoleic acid (17.6 g/100 g JS), oleic acid (3.6 g/100 g JS), and erucic acid (3.3 g/100 g JS). In contrast, the major EtOAc extract components were PUFAs represented by linoleic acid (3300.9 μg/100 g JS) and by saturated fatty acids represented by methanoic acid (2233.7 µg/100 g JS), eicosanoic acid (2578.5 µg/100 g JS), and behenic acid (982.2 µg/100 g JS).
The RP-HPLC analyses showed that all extracts contained components from the same phenolic classes (hydroxybenzoic acid, hydroxycinnamic acid, anthocyanin, and phenol) but at different percentages. According to the compound identification by RPHPLC, all the tested extracts were rich in flavonoids (52.2%, 44.6%, 31.7%, and 32.6% for the MeOH, EtOH, H2 O(1) and H2 O(2) extracts, respectively) and hydroxybenzoic acids (23.1%, 36.08%, and 22.0%, and 45.1% for the MeOH, EtOH, H2 O(1) and H2 O(2) extracts, respectively). The H2 O(1) extract showed the lowest percentage of hydroxycinnamic acid at 1.9%, followed by 12.0, 9.0, and 8.7% for the MeOH, EtOH, and H2 O(2) extracts, respectively (Table 2, Table S2-S4 and Figure S1).
At the concentration 150 µg/mL, results showed no cytotoxicity for HepG2 cells. The EtOH extract showed a significant (p < 0.005) increase in cell viability while, in contrast, the H2 O(2) extract significantly (p < 0.005) decreased the cell viability. The other extracts showed no difference compared to untreated HepG2 cells (Figure 1).
The MTT and MTS assays in the presence of fructose and insulin, respectively, demonstrated that 250 mM/mL of fructose and 7 UI/mL of insulin effectively induced a significant loss of cell viability (49.5 and 45.5%, respectively, p < 0.001). By cons, the JSE were shown to reduce this loss. The oily, EtOAc, and the two aqueous extracts significantly increased the cell viability after fructosepretreatment by up to 75% (p < 0.001) while the MeOH and H2 O(2) extracts increased the cell viability by up to 65% (p < 0.001) (Figure 2). The different extracts appeared to significantly improve the viability of insulin pre-treated HepG2 cells (p < 0.05) while the oily and aqueous extracts were more efficient than the other extracts were (Figure 2)
Comparatively to non-stressed cells, fructose and insulin overexposures significantly increased the intracellular ROS generation in HepG2 cells to 181.13% and to 261.3% (Figure 3), respectively. This would indicate that the selected concentrations were strongly affected ROS generation. When the cells were treated with JSE after fructose-induced OS, the intracellular ROS levels were significantly decreased by up to 68.7, 70.8, 83.6, 93.5, 112.5, and 58.3% for the oil, EtOAc, MeOH, EtOH, H2 O(1), and H2 O(2) extracts, respectively, and the corresponding extract values after insulin-induced OS were up to 113.4, 107.7, 94.4, 57.2, 55.6, and 98.6%, respectively/p>
As shown in Figure 4, observed untreated cells were negatively stained with DAPI. Indeed, a blue light nuclear stain was observed in the images with intact DNA. In contrast, the fructose- and insulin-stressed HepG2 cells exhibited an intense
DAPI staining. The nuclei in stressed HepG2 cells revealed an improved chromatin condensation and formation of apoptotic bodies, when exposed to high fructose concentrations. But JSE cell treatments decreased this condensation.
Comparatively, the extract effects were reduced in cells exposed to a high insulin concentration (Figure 4). Surprisingly, there were no visible differences between the extract effects on exposed cells to fructose or insulin stress.
As shown in Figure 5, the insulin-induced OS appeared to be stronger than that induced by fructose. The caspase-3 activity in insulin-treated cells was four times higher than that in the untreated ones, whereas in fructose-treated cells the caspase-3 activity was twice that in the untreated ones (p < 0.001). Incubation of HepG2-cells with JSE significantly reduced the fructose-induced activation of caspase-3 (p < 0.001) but only the EtOAc (p < 0.01) and EtOH (p < 0.05) extracts significantly lowered the insulininduced caspase-3 activity
HepG2 cells treated with fructose and insulin exhibited an increased ALT activity of almost 2.7- and 10-fold, respectively, compared to untreated cells. Results showed that the increase in ALT activity induced by fructose was less critical than that induced by insulin (Figure 6). JSE treatments decreased the fructose-induced ALT activity in HepG2 cells to normal state. The results showed that levels return to the normal after treatment with JSE exception was observed for the H2 O(2) extract, which showed a significant difference [p < 0.01 for H2 O(1) and p < 0.05 for H2 O(2)] compared to untreated cells. On the other hand, a significant (p < 0.05) decrease in insulin-induced ALT activity was observed with only oily, EtOAc, and H2 O(1) extracts (p < 0.05). Moreover, the effects of JSE were less marked in insulin-stressed cells compared to fructose-stressed cells. In fact, MeOH, EtOH, and H2 O(2) extracts showed no significant improvement.
The CAT activity to expression ratio was more significantly decreased (p < 0.05) in fructose-stressed cells than in the untreated cells due to the overexpression of this enzyme by fructose-induced-OS. Only treatment with the oily and EtOH extracts significantly (p < 0.05) increased this ratio while the other extracts showed no meaningful effect on the enzyme expression. The same SOD ratio was significantly increased (p < 0.05) in the fructose-stressed cells because of increased SOD expression, whereas the ratio decreased significantly in all the JSE-treated cells related to the increased SOD activity (Figure 7). .
With insulin treatment, the CAT ratio increased significantly (p < 0.001) because of the increased activity (p < 0.001) and significant decrease of CAT expression (p < 0.05). All JSE significantly (p < 0.001) decreased this ratio. This effect was associated with decreased activity and increased CAT expression. For the SOD ratio, insulin-induced OS significantly reduced the SOD activity pathway (p < 0.001) but this was less marked compared to that induced by fructose. However, the SOD ratio was significantly increased by JSE under all the test conditions. Moreover, this increase was significantly higher than that of the untreated conditions.
The activity and expression of the antioxidant enzymes are presented in the supplementary Data, Figure S2.
The expression of p22-phox of NADPH-oxidase was significantly increased from 100 ± 0.49% to 164.4% ± 16.3 and 145.2% ± 9.6 after induction of OS with high-fructose and-insulin, respectively. Treatment with JSE, except for EtOAc and H2 O(2) extracts, significantly reduced the expression of p22-phox (p < 0.01) after HG-induced OS. Similar results were obtained after insulin-induced OS, excepted with the EtOAc extract, which did not show any significant effect.
The activation of the pro-oxidative pathway significantly (p < 0.05) reduced the levels of Nrf2, from 100 ± 0.4 to 68.9 ± 10.0% with fructose and from 100 ± 0.2 to 46.8 ± 6.3% with insulin. Treatment of HepG2-cells with JSE failed to improve the reduction of Nrf2 expression induced by OS, except for oily, EtOAc and MeOH extracts for hyperglycemic stress and the EtOAc and MeOH extracts for hyper insulinemic stress (Figure 8).
This is the first study that demonstrates the beneficial effects of different JSE on HepG2-cells exposed to two sources of induced-OS, HG and HI, in T2D. Results showed that JSE limited the OS damage by inhibiting the HepG2 cell cytotoxicity, generation of ROS, caspase-3 activity, apoptosis, and modulating endogenous defence activity and expression, as well as cell signalling gene expression of Nrf2 and p22-phox.
The results of the GC analysis showed that oleic and erucic acids were the major fatty acid components. Our results are not in agreement with those who showed that eicosenoic and docosenoic acids were the main components of jojoba oil from plants grown in Egypt [26]. This shows that the composition of jojoba oil differs according to the soil type on which the plant source is cultivated and the climatic conditions. Furthermore, the EtOAc extract did not show the fatty acids richness as observed in the jojoba oil. Currently, no information has been reported in the literature on fatty acids extracted from EtOAc extracts of JS.
The RP-HPLC analysis showed the presence of numerous polyphenols from four classes, hydroxybenzoic acids, hydroxycinnamic acids, anthocyanins, and flavonoids. Very few studies have focused on polyphenols extracted from JS, and most are fixed on simmondsin, the major compound of this plant. Among these studies, jojoba meal has been shown to contain considerable amounts of tannins (2.5%) [18] and anthocyanins such as malvidin [27]. The leaves contain several main flavonoids including isorhamnetin 3-rutinoside (narcissine) and isorhamnetin 3,7-dirhamnoside. Indeed, 10 flavonoids and four lignans have been extracted from S. chinensis [28].
The treatment of HepG2-cells with JSE alone or after pre-treatment with a high concentration of fructose or insulin demonstrated their nontoxicity and their protective effects against damage and elevation of ROS produced by HG and HI. This finding correlates with the prevention of fructose-induced OS demonstrated by the aqueous extract and simmondsin, on RINmf cells [10] and the protective effects of JSE on metabolic syndrome induced by High Fat High Fructose diet [21]. Indeed, in the hepatocyte, fructose undergoes lysis and is phosphorylated to fructose-1-phosphate, thereby forming a primary substrate of lipogenesis, acetyl-CoA [29].
The protective effects of JSE against induced ROS production by HG or HI may be due to the presence of the numerous polyphenols. These extracts have been reported to exhibit several biological activities such as antioxidant properties. For instance, epicatechin gallate is a flavonoid widely known to have protective activity against OS in vitro by reducing ROS generation [30]. Furthermore, quercetin, rutin, and gallic acid act against OS by chelating cations or as free radical scavengers [31]. The protective effect of ferulic acid presented in our JSE on hepatotoxicity and OS has been attributed to its phenoxyl hydrogen atom that removes free radicals [32]. Furthermore, sinapic acid showed hepatoprotective effect against OS induced by dimethylnitrosamine-induced chronic liver damage in rats [33]. The protective effect of this hydroxycinnamic acid is due to its ability to maintain the liver cell activity and to suppress transforming growth factor [33]. The fatty acid composition of jojoba oil and the EtOAc extract does not explain their mode of action in protecting against OS. However, a study by El-Mallah and El-Shami showed the presence of tocopherol in jojoba oil. This compound can trap ROS, leading to stabilization of the cell membrane [34].
ROS, produced during cellular metabolism following environmental disturbances, play a major role in cellular signal transduction. Therefore, aberrant signalling can lead to physiological disturbances such as apoptosis. It has been proven that caspase-3 plays a central role in apoptosis [35]. Our results revealed that the generation of ROS by HG increased apoptosis by activating caspase-3, which is in agreement with a previous study stating that exposure of skeletal muscle cells to fructose increased the mitochondrial ROS generation, leading to apoptosis [36].
HepG2 cells treatment with JSE after fructose-OS highly and significantly reduced the caspase-3 activity, which consequently inhibited apoptosis. This protection observed after EtOH extract testing, could be due to its epicatechin and rutin contents, known to be an inhibitor of H2 O2 production and then, a suppressor of caspase-3 activity [37]. A previous study on Leydig cells indicated that rutin decreased caspase-3 activity and attenuated the damage caused by H2 O2 -induced oxidation and the apoptosis due to phosphoinositide 3-kinase /protein kinase B, which decreased the OS.
Our study demonstrated that OS increased the ALT level. This augmentation is well known to be associated with the hepatocyte lysis. Our results are in agreement with those of studies performed with fructose induced non-alcoholic fatty liver disease rats [38].
Indeed, a high-fructose diet causes insulin resistance and increases ALT [21] . Incubation of HepG2 cells with JSE after OS decreased ALT level compared with fructose-stressed cells. This regulation may be due to the presence of several antioxidant molecules such as flavonoids, which have been found to inhibit ATL activity [39].
In the current study, OS modulated the antioxidant defence status. In fact, CAT activity increased after induction of both types of two stresses, whereas SOD expression increased after fructose stress and decreased with hyperinsulinemic stress. These findings are in accordance with those who demonstrated that SOD activity was increased in peripheral blood mononuclear cells of patients with T2D compared with untreated patients [40]. This elevated SOD activity could be an underlying compensatory mechanism against the increase in OS [40]
At the molecular step, overexpression of the p22-phox after HG and HI OS was observed. These two types of OS appeared to activate the pro-oxidant agent, p22-phox. Enhanced ROS production by NADPH-oxidase is correlated with changes in antioxidant enzyme activity [41]. The modulation of p22-phox expression by the different JSE was also correlated with the modulation of antioxidant enzyme activity. Our results are in agreement with several studies which showed the overexpression of this pro-factor following OS [42]. In contrast, OS decreased Nrf2 expression, demonstrating that the hepatic cells could not fight against OS and activate relevant defenses. Fortunately, treatment of HepG2 cells with JSE increased the expression of Nrf2, which subsequently activated cellular defenses. This was confirmed by the improvement in cell viability and decreased cell apoptosis induced by JSE. The activation of Nrf2 could be due to the presence of apigenin, which activate peroxisome proliferator-activated receptor [43]. Furthermore, the presence of rutin, which is transformed into a quinone that enhances adaptation by upregulating the Nrf2-mediated endogenous antioxidant response [44] and quercetin, which activates mitogen-activated protein kinases [45], likely contributed to these effects.
In the nucleus, a nicotinamide adenine dinucleotide (NAD+) histone deacetylase, Silent Information Regulator 1 (SIRT1) from the mammalian sirtuin family, plays an important role in regulating the apelinergic pathway for T2D in relation to cerebral insulin resistance (stroke, dementia, AD) and type 3 diabetes [46]. People with T1D and T2D require early and advanced organ diseases of the brain when combined with type 3 diabetes and liver with repression of SIRT1 deeply involved in insulin resistance in people [47]. A study showed that polyphenols stimulate the deacetylase activity of the recombinant protein Sirt1 and could therefore be a potential regulator of aging-related processes.
In our study and according to the results published previously, it can be concluded that Sirt 1 is stimulated by polyphenols and that the SIRT1/Nrf2 pathway can oppose the oxidative damage caused by HG and HI by improving the antioxidant capacity of the organism In this context, it has been shown that down-regulation of SIRT1 expression significantly reduced Nrf2 protein expression [48]. More, other studies have shown that Sirt1 overexpression can deacetylate Nrf2, increase its stability, then its transport to the nucleus, promote the transcriptional activity of Nrf2 and enhance the resistance of cells to oxidative damage. [49, 50].
Based on these results, it can be concluded that sirtuin 1 is essential for the control of oxidative stress, HG and insulin release. Indeed, it has been reported that Sirtuin 1 is essential for hepatocyte function, against hepatocyte complications in diabetes, and that its inactivation leads to Non Alcoholic Fatty Liver Disease [51-53]. Moreover, connections between Sirt 1 and other anti-aging genes such as Klotho, p66Shc (longevity protein) and Forkhead box proteins (FOXO1/FOXO3a) have been associated with programmed cell death. Alterations in these genes anti-aging regulate glucose, lipids and amyloid beta metabolism which are important for various chronic diseases.
JSE reduced OS induced by HG and HI in hepatocytes and beneficial effects of JSE are not only due to the fatty extracts or polyphenols, but a combination of several molecules likely induced a synergistic effect that could potently reduce hepatic complications in diabetes.

![]()

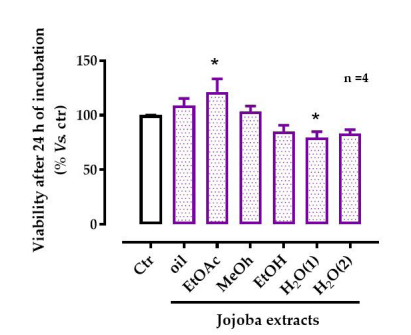 |
| Figure 1: Effect of jojoba extracts on viability of HepG2 cells All values are mean ± standard deviation (SD); *p < 0.05 compared to untreated cells; ctr, control |
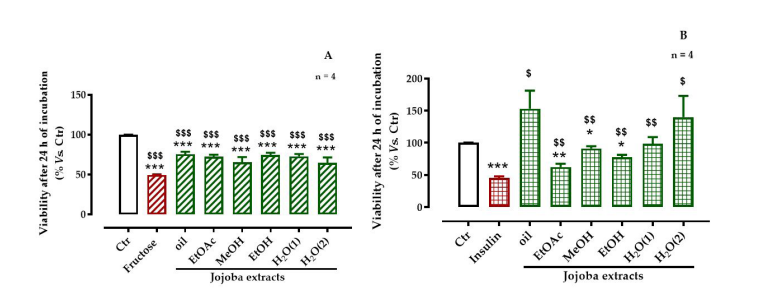 |
| Figure 2: Effect jojoba extracts on viability of HepG2 cells in the presence of (A) high-fructose or (B) high-insulin concentrations All values are means standard deviation (SD); * p < 0.05, ** p < 0.01, and *** p < 0.001 compared to untreated cells; $ p < 0.05, $$ p < 0.01, and $$$ p < 0.001 compared to fructose- or insulin-treated cells; ctr, control |
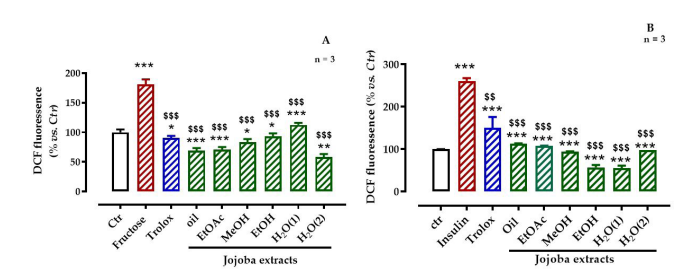 |
| Figure 3: Effect of jojoba extracts on (A) high-fructose- or (B) high-insulin-induced oxidative stress All values are means standard deviation (SD); * p < 0.05, ** p < 0.01, and *** p < 0.001 compared to untreated cells; $ p < 0.05, $$ p < 0.01, and $$$ p < 0.001 compared to fructose- or insulin-treated cells; ctr, control |
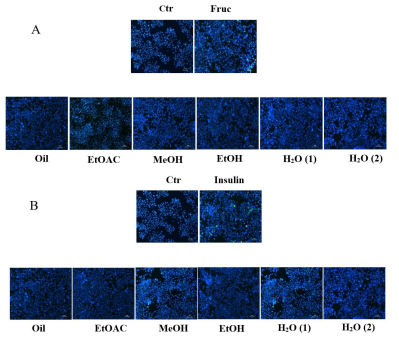 |
| Figure 4: Effect of jojoba extracts on (A) high-fructose- or (B) or high-insulin-induced apoptosis |
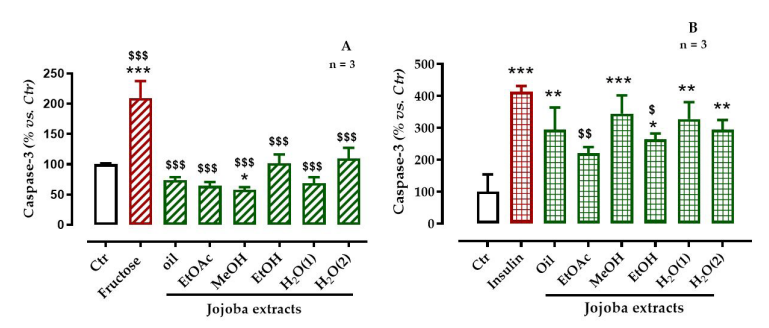 |
| Figure 5: Effect of jojoba extracts on caspase-3 activity of cells exposed to (A) high-fructose or (B) high-insulin All values are mean standard deviation (SD); * p < 0.05, ** p < 0.01, and *** p < 0.001 compared to untreated cells; $ p < 0.05, $$ p < 0.01, and $$$ p < 0.001 compared to fructose- or insulin-treated cells |
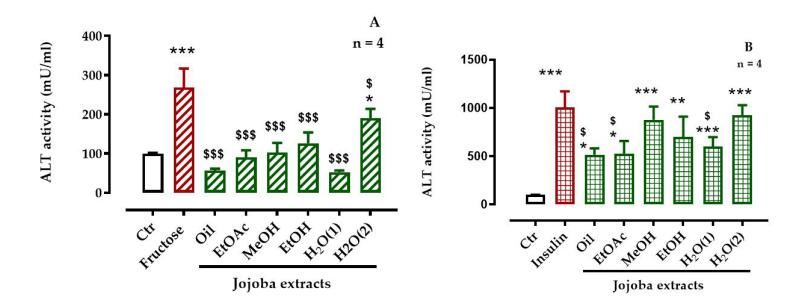 |
| Figure 6: Effect of jojoba extracts on alanine aminotransferase (ALT) activity in (A) high-fructose or (B) high-insulin treated cells |
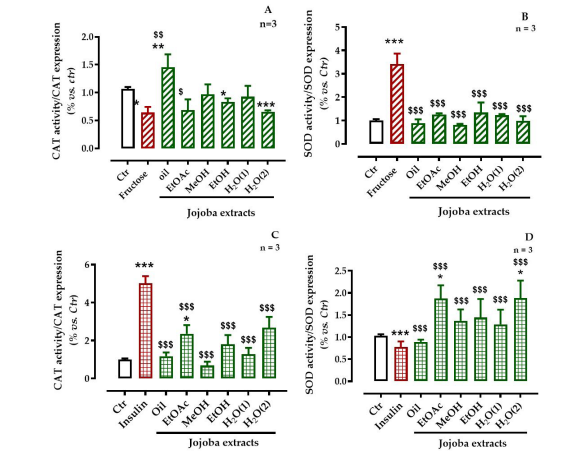 |
| Figure 7: Effect of jojoba extracts on antioxidant enzymes (superoxide dismutase [SOD] and catalase [CAT]) in high-fructose- or high-insulin-stressed cells All values are means standard deviation (SD); * p < 0.05, ** p < 0.01, and *** p < 0.001 compared to untreated cells; $ p < 0.05, $$ p < 0.01, and $$$ p < 0.001 compared to fructose-treated cells; ctr, control |
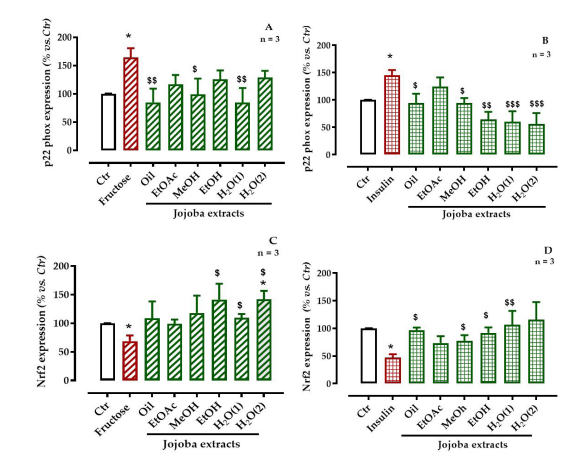 |
| Figure 8: Effect of jojoba extracts on pro-oxidant (p22-phox subunit of NADPH oxidase) and anti-oxidative (the nuclear factor, Nrf2) signaling pathways in high-fructose- or high-insulin-stressed cells All values are means standard deviation (SD); * p < 0.05, ** p < 0.01, and *** p < 0.001 compared to untreated cells; $ p < 0.05, $$ p < 0.01, and $$$ p < 0.001 compared to fructose-treated cells; ctr, control |
Acid group |
Fatty acid |
Retention time (min) |
Quantity (g/100g) |
Saturated fatty acids |
Octanoic acid |
1.90 |
0.02 |
Methanoic acid |
2.23 |
0.03 |
|
Tetradecanoic acid |
3.75 |
0.01 |
|
Hexadecanoic acid |
5.51 |
0.35 |
|
Octadecanoic acid |
8.26 |
0.01 |
|
Eicosanoic acid |
12.02 |
0.03 |
|
Docosanoic acid |
16.17 |
0.17 |
|
Monounsaturated fatty acids |
Palmitoleic acid |
5.78 |
0.10 |
Oleic acid |
8.71 |
3.63 |
|
Gadoleic acid |
12.68 |
17.60 |
|
Erucic acid |
16.80 |
3.35 |
|
Polyunsaturated fatty acids |
Linoleic acid |
9.46 |
0.04 |
α-Linolenic acid |
11.00 |
0.06 |
|
Nervonic acid |
21.84 |
0.02 |
|
Stearidonic acid |
11.63 |
0.27 |
|
Docosapentaenoic acid (DPA) |
20.55 |
0.50 |
|
Docosahexaenoic acid (DHA) |
21.17 |
0.29 |
|
NI |
15.95 |
10.26 |
|
NI |
20.45 |
9.22 |
Phenolic class |
Phenol name |
Retention |
% |
Hydroxybenzoic acid |
Syringic acid |
28 |
4.81 |
Gallic acid |
3.1 |
15.53 |
|
3',5'Dihydroxybenzoic acid |
3.7 |
1.55 |
|
p-Hydroxybenzoic acid |
21 |
1.24 |
|
Hydroxycinnamic acid |
Caffeoylquinic acid |
18.3 |
0.78 |
Caffeic hexoside acid |
23.7 |
1.55 |
|
p-Coumaric acid |
34.2 |
5.74 |
|
Ferulic acid |
39.5 |
2.33 |
|
Sinapic acid |
42.5 |
1.55 |
|
Anthocyanin |
Cyanidine-3-rutinoside |
29.2 |
5.43 |
Flavonoid |
Catechin (+) |
24.4 |
4.50 |
Kaempferol 3-glucoside |
28.7 |
0.93 |
|
Apigenin 7-rutinoside |
29.6 |
1.242 |
|
Quercetin 3',4'-diglucoside |
31.88 |
1.24 |
|
Rutin |
38.15 |
9.94 |
|
Epicatechin gallate |
45.47 |
22.05 |
|
Quercetin |
58.5 |
3.89 |
|
Isorhamnetine-3-glucoside |
59.5 |
8.38 |
|
|
NI |
22.1 |
0.93 |
|
NI |
33.1 |
0.93 |
|
NI |
36.6 |
0.78 |
|
NI |
61 |
4.66 |


