 |
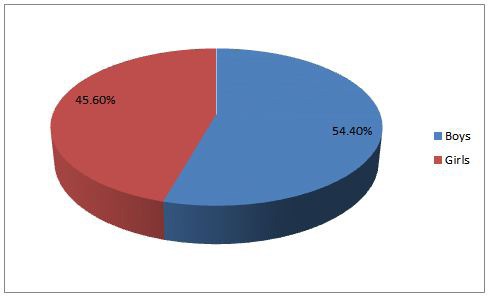
| Figure 1: Gender of the children Boy and girl distribution was 54.40% and 44.60%. |
|
| Figure 1: Gender of the children Boy and girl distribution was 54.40% and 44.60%. |
Age group (month) |
Percentage |
Frequency |
|||||||||||
0-11 |
20.14 |
23 |
|||||||||||
12-23 |
24.3 |
28 |
|||||||||||
24-35 |
15.97 |
18 |
|||||||||||
36-47 |
27.09 |
31 |
|||||||||||
48-59 |
12.5 |
14 |
|||||||||||
Total |
100.0 |
114 |
|||||||||||
Table 1: Distribution of age group |
|||||||||||||
Indicator |
Number |
Percentage |
Normal% |
||||||||||
Stunting |
74 |
64.9 | 33.3 | ||||||||||
Under weight |
98 |
85.96 |
12.3 |
||||||||||
Wasting |
94 |
82.46 |
17.5 |
||||||||||
| Prevalence of stunting, underweight and wasting was 64.9%, 85.96% and 82.46% respectively. Table 2: Prevalence of malnutrition |
|||||||||||||
Indicator (Z-score) |
Number |
Percentage |
|||||||||||
Severely stunted (< -3SD) |
62 |
54.4 |
|||||||||||
Moderately stunted (-3SD to – 2SD) |
12 |
10.5 |
|||||||||||
Normal height (>-2SD to 2SD) |
38 |
33.3 |
|||||||||||
Above normal (>+2SD) |
2 |
1.8 |
|||||||||||
Table 3: Prevalence of stunting of children Severe and moderate stunted were 62% and 12% |
|||||||||||||
Indicator (Z-score) |
Number |
Percentage |
|||||||||||
Severely underweight (<-3SD) |
68 |
59.6 |
|||||||||||
Moderately underweight (-3SD to <– 2SD) |
18 |
15.8 |
|||||||||||
Mildly underweight (>-2SD to <-1SD) |
12 |
10.5 |
|||||||||||
Normal (>-1SD to +1SD) |
14 |
12.3 |
|||||||||||
Overweight (>+1 SD) |
2 |
1.8 |
|||||||||||
Table 4: Prevalence of underweight of children Severe and moderate underweight were 68% and 18% |
|||||||||||||
Indicator (Z-score) |
Number |
Percentage |
|||||||||||
Severely stunted (< -3SD) |
62 |
54.4 |
|||||||||||
Moderately stunted (-3SD to – 2SD) |
12 |
10.5 |
|||||||||||
Normal height (>-2SD to 2SD) |
38 |
33.3 |
|||||||||||
Above normal (>+2SD) |
2 |
1.8 |
|||||||||||
Table 5: Prevalence of wasting of children Severe and moderate wasted were 60% and 20% |
|||||||||||||
Category |
Number |
Percentage |
|||||||||||
Normal (>13.5cm) |
16 |
14 |
|||||||||||
At risk of malnutrition (12.5 to13.4cm) |
6 |
5.2 |
|||||||||||
Moderate acute malnutrition |
38 |
33.3 |
|||||||||||
(>11.5cm and <12.4cm) |
14 |
12.3 |
|||||||||||
Severe acute malnutrition (<11.5cm) |
78 |
68.5 |
|||||||||||
Table 6: Nutritional status of Rohingya children (<5 years) based on their MUAC |
|||||||||||||