Open Access
Research Article
Max Screen >>
ISSN: 2393-9060
Copyright: © 2018 Lyons-Dobney LE. This is an open-access article distributed under the terms of the Creative Commons Attribution License, which permits unrestricted use, distribution, and reproduction in any medium, provided the original author and source are credited.
Related article at Pubmed, Google Scholar
Objective:To identify pathogens that are frequently isolated from wound infections in the Turks and Caicos Islands and formulate antibiogram based on their patterns of antimicrobial susceptibility.
Materials and Methods: Bacteriology and antimicrobial susceptibility data from 1343 wound swabs cultured at the Cheshire Hall Medical Laboratory between January 2013 and November 2015 were retrospectively analyzed. The Kirby-Bauer disc diffusion technique was used to perform antimicrobial susceptibility testing.
Results: 79.1% of the 1343 swabs cultured were positive yielding a total of 1687 bacterial isolates. Frequently isolated bacteria included Staphylococcus aureus which accounted for 27.6% of isolates, approximately a third of which were methicillin resistant, Pseudomonas spp. (12.1%), Proteus spp. (8.2%), Enterococcus spp. (7.8%), E. coli (7.2%), Streptococcus agalactiae (6.1%), Klebsiella spp. (5.5%), Acinetobacter spp. (4.3%), coagulase negative Staphyloccus (4.0%) and Enterobacter spp. (3.7%). The overall highest resistance rates were seen among tetracycline (46.3%), erythromycin (37.6%) and ceftriaxone (34.2%). Imipenem, penicillin, meropenem and vancomycin had sensitivity rates ranging from 92.3% to 99.5%. Individual resistance rates varied among isolates, some differing significantly from overall rates. When tested against antibiotics routinely used to treat Pseudomonas spp., resistance rates ranged from 1.4-55.5%.
Conclusion: Overall antibiotic resistance rates were below 50%, however, some isolates show resistance rates of up to 95.9%. Sharing of information concerning the antibiogram, as well as, future updates with community physicians is recommended.
Keywords:Wound infection; Antibiogram; Antibiotic resistance; Antimicrobials; Caribbean
Wound infections are costly both in economic and human terms. They can lead to increased healthcare costs due to lengthy hospital stays and costly antimicrobial treatment in addition to anxiety, discomfort, chronic wounds, and loss of limbs, morbidity and mortality [1,2]. The Canadian Institute for Health Information (CIHI) claimed that during 2011-2012 more than 2,000 foot amputations were attributed to diabetic wound infections alone [3]. Common pathogens isolated from wound infections include Staphylococcus aureus, Pseudomonas aeruginosa, Escherichia coli, Klebsiella pneumoniae, Coagulase negative Staphylococcus, Enterococcus spp. Enterobacter spp. and Proteus spp. [2,4-6]. Antimicrobial resistance can complicate treatment of wound infections and cause prolonged debility and significantly increase healthcare costs [7,8]. As resistance rates increase, the efficacy of antimicrobial agents in treating bacterial infections decreases [9]. Antibiotic resistance is largely attributed to the overuse of these drugs [10,11]. Nathan [12] expressed that the bacterial pathogens that are most commonly isolated from wound infections are already resistant to most antibiotics. Filus & Gyssens [8] suggested that information concerning causative pathogens and their susceptibility patterns can lead to more appropriate prescription of antimicrobials. Resistance patterns are not identical among all regions or locations, for example tetracycline sensitivity rate for North East Ethiopia was 76.1% [1] while in India the rate was comparably lower at 42.1% [5]. Also, in neighboring Jamaica, the resistance rate for Pseudomonas against gentamicin was 35.7% [13] while North East Ethiopia had a much lower resistance rate of 7.8% [1]. Country specific antimicrobial resistance data for wound infection pathogens might indisputably be among the most important information necessary for slowing the development of resistance among these organisms through more effective prescription of antimicrobials. This study aims to identify wound pathogens as well as ascertain their prevailing antimicrobial susceptibility in the Turks and Caicos Islands (TCI).
Data concerning organisms and antimicrobial resistance for all wound swabs processed at the Cheshire Hall Medical Laboratory from January 2013 to November 2015 were extracted from the laboratory information system’s statistics module and reviewed.
Wound swabs were collected using sterile swabs in transport media and inoculated to Tryptic Soy Agar with 5% sheep blood (TSA) (aerobic & anaerobic), MacConkey and BBL Columbia-CNA (CNA) agar plates and incubated at 37 °C for 24 - 48 hours. Swabs for screening for Methicillin resistant Staphylococcus aureus (MRSA) were inoculated to CNA and CHROM Methicillin resistant Staphylococcus aureus Agar (CHROM MRSA) only and incubated at 37 °C for 24 to 48 hours.
Plates were sourced from Becton, Dickenson and Company (BD BBL) and Hardy Diagnostics in the United States of America (USA). Isolates were identified using various combinations of commercially prepared tests including: BD catalase, Staph latex, Strep Pro, Strep quick and Microgen Gram negative by Hardy Diagnostics, Alere PBP 2a and Biomerieux API 20E ID systems. Organisms that proved difficult to identify in the laboratory were sent to Lab Corp USA. Suspensions for antibiotic sensitivity were standardized to 0.5 McFarland standards using Grant-bio McFarland densitometer and applied to the relevant agar plates using sterile cotton swab. Antibiotic discs from the prescribed panel were immediately placed on agar and incubated at 37 °C for 24 hours. BD-BBL antibiotic discs were used and included: Amoxicillin/Clavulanic Acid (Augmentin) (20/10ug), Ceftazidime (30ug), Ceftriaxone (30ug), Ciprofloxacin (5ug), Gentamicin (10ug), Meropenem (10 ug), Sulfamethoxazole (23.75ug)/Trimethoprim (1.25ug) (Bactrim), Amikacin (30ug), Tobramycin (10ug) Piperacillin (100ug), Erythromycin (15ug), Clindamicin (2ug), Penicillin (10 IU/IE/UI), Rifampin (5ug) and Vancomycin (30ug). Antibiotic package inserts along with CLSI (2013) guidelines were used to interpret susceptibility status. E. coli ATCC25922, S. aureus ATCC25923 and P. aeruginosa ATCC27853 were used as quality control to monitor the activity of the antibiotic discs.
Ethics approval was obtained from the Ethics Committee of the Turks and Caicos Islands Hospitals which owns and operates the Cheshire Hall Medical Laboratory.
During the period of January 2013 to November 2015, a total of 1343 wound swabs were cultured including 96 for which the only isolate of interest was MRSA. 1114 (79.1%) swabs were positive yielding 1687 isolates, 840 of which were gram negative isolates representing an almost equal ratio between gram negative bacilli and gram positive cocci.
As shown in Figure 1, Staphylococcus aureus was the most common pathogen isolated from the wound swabs and accounted for 27.6% of isolates. Approximately, one-third of these isolates were methicillin-resistant. Other frequently isolated organisms included: Pseudomonas spp. (12.1%), Proteus spp. (8.2%), Enterococcus spp. (7.8%), E. coli (7.2%) Streptococcus agalactiae (6.1%), Klebsiella spp. (5.5%) and Acinetobacter spp. (4.3%), coagulase negative Staphyloccus (CNS) (4.0%) and Enterobacter spp. (3.7%).
Figure 2 and Table 1 and Table 2 represent the antimicrobial resistance patterns of bacterial pathogens which are frequently isolated from wound swabs received in the Cheshire Hall Medical Laboratory in TCI.
Results revealed that the highest overall resistance rates were seen among tetracycline (46.3%) followed by erythromycin (37.6%) and ceftriaxone (34.2%). Imipenem, penicillin, meropenem and vancomycin had sensitivity rates ranging from 92.3% to 99.5%. Individual resistance rates varied among isolates, some differing significantly from overall rates as seen in augmentin where overall rate was 25.7 %, however, against Enterobacter spp., resistance rate was 87% and 0.9% for Non- MRSA (Figure 2).
Ciprofloxacin and bactrim are still largely effective against Acinetobacter in vitro. Resistance rates for augmentin and ceftriaxone against E coli are just below 50% while ciprofloxacin and bactrim have already exceeded 50%. Resistance rates for Klebsiella remain below 30% except for bactrim (45.5%).With the exception of ceftriaxone (55.5% resistance rate), resistance rates for Pseudomonas spp. against antimicrobials tested were below 23%. Proteus species has very good susceptibility to the panel of antibiotics frequently used for treatment of wounds with the highest resistant rate of 32.2% against bactrim.
Enterococcus spp. has the highest resistance rate for all antibiotics tested with 95.9% against clindamycin. No vancomycin resistant Enterococcus (VRE) was isolated. Although most frequently isolated, Non-MRSA had overall lowest resistance rates ranging from 0.4% against vancomycin to 16.2% against erythromycin. Streptococcus agalactiae (group B strep) has a high rate of resistance against bactrim (87.5%).
Wound infections cause significant economic and human cost through various modalities. For hospitals with limited beds and financial resources, increase duration of hospitalization and related medical expenses associated with wound infections [6] might prove extremely problematic. As antimicrobial resistance increases, it will become more difficult to treat infections [9,11,12]. Since antimicrobial resistance cannot be prevented, conservative and evidence based prescription might be the most important means of slowing down the rates at which bacteria acquire resistance [2,11]. This cannot be effectively done unless health physicians have reliable information regarding antimicrobial susceptibility patterns of bacterial pathogens they are likely to encounter. A similar study conducted by in North East Ethiopia by Azene and Beyene [1] had comparable positive rates for wounds cultures even though the sample size was less than half the size of this study. The top two isolates from wound infections were identical to this study; however, the percentages were dissimilar. This was also the case with a significantly smaller study conducted in India [5]. Whilst S. aureus accounted for an overwhelming 41.6% of wound infection isolates in North East Ethiopia [1], the isolation rate for the organism in this study was similar to that of the Indian study with rates of 27.6 and 26.2% respectively. Recovery rates for Pseudomonas spp. was 12.1% of isolates in this study, 18.4% in North East Ethiopia [1] and 20.2% in India [5]. A study conducted in Latin America by Gales et al. [14] yielded recovery rates of S. aureus 31%, Pseudomonas spp. 11% while E coli accounted for 13.4% of pathogens compared to 7.2% in this study.
Resistance rates in North-East Ethiopia [1] were significantly higher for tetracycline and erythromycin at 76.5% and 63.9% respectively compared to 46.3% and 37.6% in TCI. Individual rates for third generation cephalosporin, ceftriaxone was also significantly higher than this study with resistance rates of 66.7% for E coli and 64.0% for Proteus spp. compared to 45.1% and 10.9% respectively. This high resistance rate for ceftriaxone coupled with the 46.8% resistance rate for E coli against augmentin might be indicating that TCI is fertile ground for the increased development of Extended-spectrum beta lactamase (ESBL) E coli which could further increase the cost of wound management.
Resistance rates of Pseudomonas spp. varies among regions; resistance rates to ciprofloxacin was 18.6% in this study, 16.2% in the Indian study [5], 25% in a study conducted in Jamaica [13] but was significantly lower in North-East Ethiopia [1] with 4.6%. Regional differences in antibiotic resistance rates make the need for studies of this nature even more important for small countries like the TCI who depend heavily on an international labor force to keep the healthcare sector viable.
In TCI, resistance rates for oral antibiotics such as augmentin, ciprofloxacin and bactrim used to treat gram negative bacilli are either approaching the 50% resistance rate or have already exceeded it. Treatment with intramuscular and IV preparations could result in increased hospital visits and hospitalization.
Development of antibiotic guidelines and adherence to the same could definitely lead to more uniform and evidence –based prescription. This could reduce the rate of development of antimicrobial resistant bacteria and lead to better outcomes for wound patients. The large numbers of wound swabs cultured in the context of a population of approximately 50,000 might raise questions regarding the possibility of oversampling. Bowler et al. [2] suggests that only wounds that are likely to benefit from microbiological investigation should be sampled. This study did not differentiate poly microbial wound infections from those with single isolates, neither, were findings correlated with patients’ demographics or clinical findings.
This study highlights the prevalence and antimicrobial resistance patterns of bacterial isolates recovered from wound swabs processed at the Cheshire Hall Medical Laboratory. Since this is the sole microbiology laboratory in TCI, the information is representative of the country profile.
The findings of this study agreed with several other studies concerning the most frequent bacterial pathogens isolated from wounds, however, there were variations in antimicrobial resistance rates where meaningful comparisons were facilitated. Further investigation into how wound culture reports are interpreted might be beneficial to overall wound care.
The author wishes to thank the following persons and teams: the Cheshire Hall medical technologists who have processed the samples over the period, the TCI Hospital information management team who provided background information relevant to the context of the study, Doctors Amatti and Blythe who provided clinical support as needed and Detorrie Tennant and Samuel Lawrence who provided technical support with construction of the figures and tables

![]()

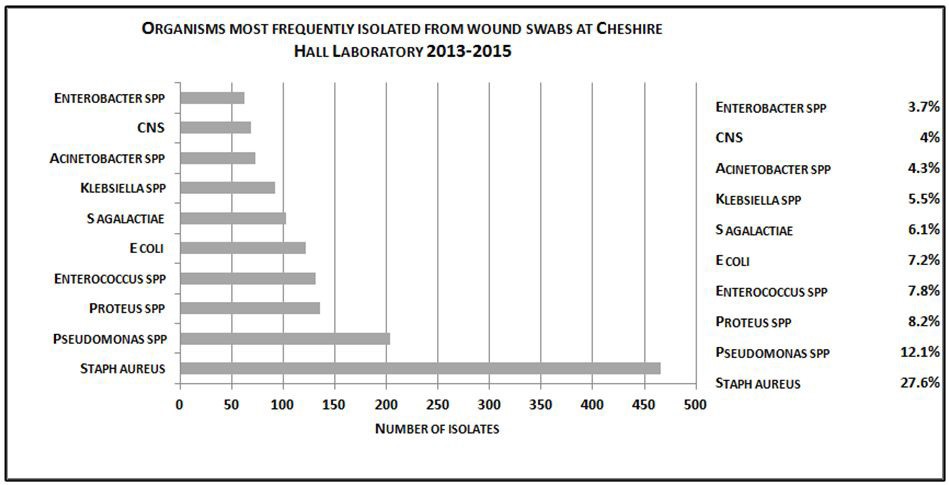 |
| Figure 1: Organisms most frequently isolated from wound pathogens at Cheshire Hall Laboratory 2013 -2015, identified by |
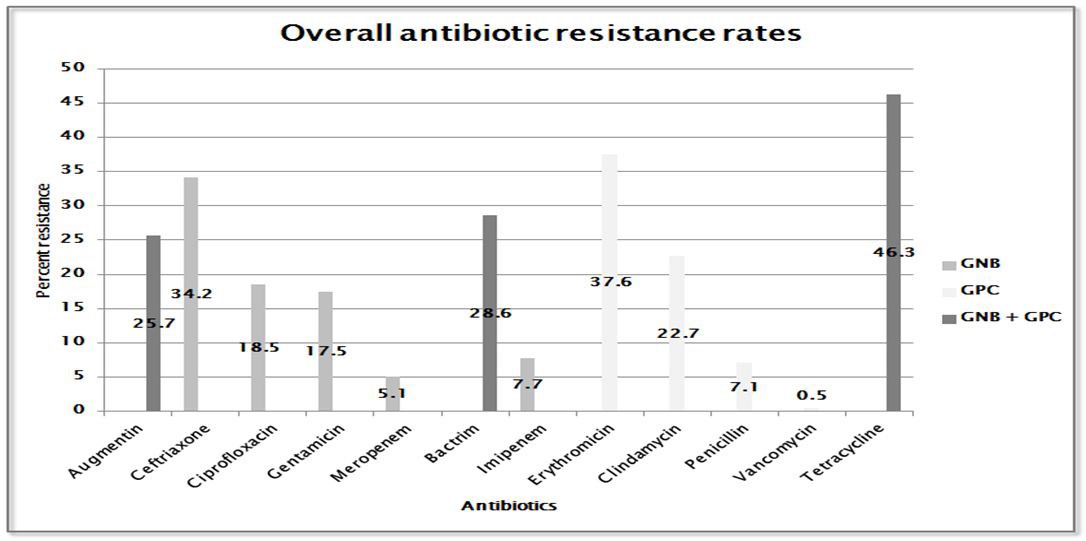 |
| Figure 2: Overall resistance rates of antibiotics tested against all pathogens isolated |
Antimicrobial Agents |
Acinetobacter spp. N=73 |
Enterobacter spp. N=62 |
E Coli N=122 |
Klebsiella spp. N=92 |
Proteus spp. |
Pseudomonas spp. N=204 |
|||||||
|
n |
%R |
n |
%R |
n |
%R |
n |
%R |
n |
%R |
n |
%R |
|
Augmentin (20/10ug) |
68 |
53.9 |
62 |
87.0 |
110 |
46.8 |
88 |
25.0 |
128 |
22.7 |
|
|
|
Ceftriaxone (30 ug) |
52 |
44.2 |
51 |
26.2 |
104 |
45.1 |
82 |
20.7 |
129 |
10.9 |
54 |
55.5 |
|
Ciprofloxacin (5 ug) |
71 |
11.3 |
62 |
2.9 |
115 |
56.5 |
88 |
15.9 |
132 |
5.3 |
188 |
18.6 |
|
Gentamicin (10 ug) |
72 |
18.0 |
62 |
7.7 |
116 |
36.2 |
90 |
12.2 |
130 |
4.6 |
190 |
22.1 |
|
Meropenem (10 ug) |
43 |
12.2 |
62 |
4.4 |
107 |
0.0 |
71 |
1.4 |
108 |
0.9 |
181 |
11.0 |
|
Bactrim (23.75/1.25 ug) |
49 |
24.6 |
58 |
17.2 |
117 |
68.2 |
77 |
45.5 |
118 |
32.2 |
|
|
|
Amikacin (30 ug) |
|
|
|
|
|
|
|
|
|
|
101 |
4.0 |
|
Tobramicin (10 ug) |
|
|
|
|
|
|
|
|
|
|
113 |
21.2 |
|
Piperacillin (100 ug) |
|
|
|
|
|
|
|
|
|
|
128 |
1.6 |
|
Ceftazidime (30 ug) |
|
|
|
|
|
|
|
|
|
|
103 |
5.8 |
|
Key:N= Number of isolates; n=number of isolated tested against individual antimicrobial; %R= resistance rates (percent of isolates resistant to antimicrobial agent) |
|||||||||||||
Antimicrobial Agents |
NON MRSA N=328 |
MRSA N=138 |
CNS N=69 |
Enterococcus spp. N=131 |
S. Angalactiae N=103 |
||||||||
|
n |
%R |
n |
%R |
n |
%R |
n |
%R |
n |
%R |
|||
Augmentin (20/10ug) |
323 |
0.9 |
|
|
65 |
4.0 |
129 |
7.8 |
101 |
6.1 |
|||
Bactrim (23.75/1.25 ug) |
316 |
6.0 |
105 |
6.7 |
65 |
50.8 |
99 |
21.2 |
88 |
87.5 |
|||
Erythromycin (15 ug) |
321 |
16.2 |
120 |
83.3 |
65 |
56.9 |
115 |
63.5 |
95 |
16.8 |
|||
Clindamycin (2 ug) |
324 |
2.2 |
135 |
20.7 |
62 |
32.3 |
121 |
95.9 |
96 |
11.5 |
|||
Pencillin (10lU/IE/Ul) |
|
|
|
|
|
|
77 |
9.1 |
96 |
1.0 |
|||
Vancomycin (30 ug) |
260 |
0.4 |
120 |
0.0 |
107 |
3.7 |
101 |
0.0 |
66 |
0.0 |
|||
Rifampin (5 ug) |
|
|
68 |
1.5 |
|
|
|
|
|
|
|||
Key: CNS=-Coagulase negative staphulococcus; Non-MRSA= non methicillin-resistant S.aureus; MRSA= methicillin-resistant S.aureus; N= Number of isolates; n=number of isolated tested against individual antimicrobial; %R= resistance rates (percent of isolates resistant to antimicrobial agent). |
|||||||||||||


