 |
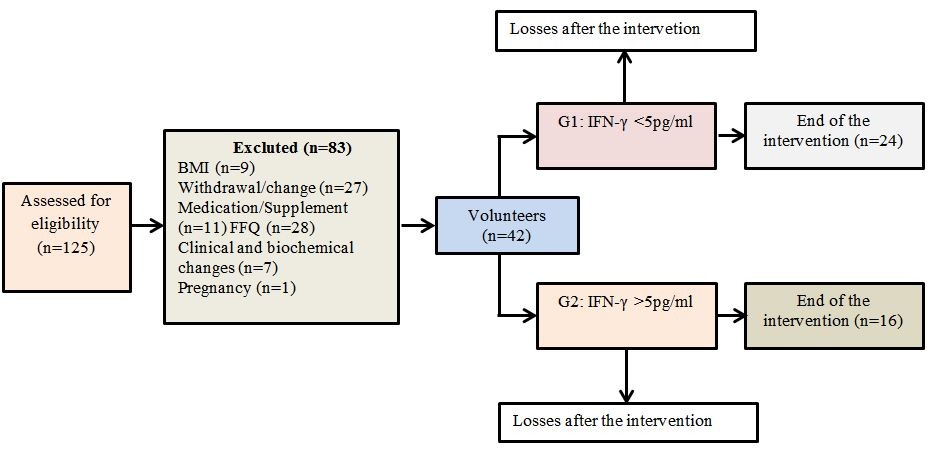
| Figure 1:Flow diagram of volunteers |
|
| Figure 1:Flow diagram of volunteers |
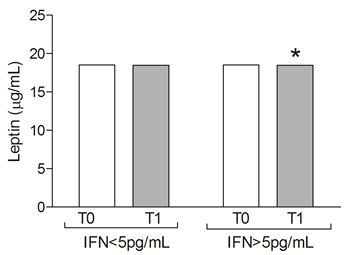 |
| IFN, Interferon gamma; T0: Baseline characteristics (before the intervention). T1: Final characteristics (after the intervention). Data are presented as mean and standard deviation, and were analyzed with Normality test: Kolmogorov- Smirnov, p<0.05 and paired t-Student. *p=0.035. |
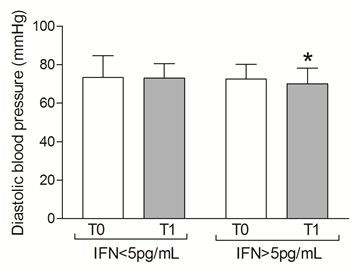 |
| IFN, Interferon gamma; T0: Baseline characteristics (before the intervention). T1: Final characteristics (after the intervention). Data presented as mean and standard deviation, and were analyzed with Normality test: Kolmogorov- Smirnov, p<0.05 and paired t-Student. *p=0.006 |
|
|
IFN<5pg/mL (n=24) |
IFN>5pg/mL (n=16) |
||||||||||
Variable |
T0 |
T1 |
p*a |
T0 |
T1 |
p*a |
p*b |
||||||
Anthropometric and body composition parameters |
|||||||||||||
Body weight, Kg |
68.65±14.58 |
69.2(57.3-87.5) |
0.144 |
62.7±11.85 |
59.5(51.5-70.8) |
0.613 |
0.199 |
||||||
BMI, Kg/m2 |
25.05(20.85-29.0) |
25.44(21.9-31.2) |
0.310 |
21.8(20.9-27.5) |
21.9(20.5-26.4) |
0.825 |
0.590 |
||||||
Waist circumference, cm |
76.72±10.23 |
79.3±10.7 |
0.116 |
73.6±5.96 |
72.9±6.5 |
0.258 |
0.235 |
||||||
Truncal fat, % |
54.83±5.08 |
55.5±5.97 |
0.193 |
52.7±6.07 |
55.4±4.65 |
0.472 |
0.256 |
||||||
Body fat (BIA), % |
32.5±5.06 |
35.54±4.97 |
0.08 |
30.6±5.53 |
30.3±4.2 |
0.396 |
0.279 |
||||||
Clinical parameters |
|||||||||||||
Systolic blood pres- sure, mmHg |
106.1±12.6 |
106.3±10.6 |
0.09 |
105.1±12.1 |
100.8±12.1 |
0.248 |
0.808 |
||||||
Diastolic blood pres- sure, mmHg |
73.3±11.3 |
73.01±7.6 |
0.424 |
72.5±7.7 |
70.12±8.06 |
0.035 |
0.803 |
||||||
Biochemical parameters and inflammatory mediators |
|||||||||||||
Glucose, mg/dL |
79.12(75-81.5) |
79.8±7.26 |
0.879 |
78.5(75-85.3) |
79.7±5.7 |
0.671 |
0.579 |
||||||
Insulin, μIU/mL |
6.6±2.3 |
6.84±2.91 |
0.229 |
5.76±2.03 |
5.9±2.2 |
0.954 |
0.214 |
||||||
HOMA-IR |
1.4±0.5 |
1.47(0.8-1.6) |
0.318 |
1.17±0.54 |
1.08±0.5 |
0.551 |
0.308 |
||||||
Cholesterol, mg/dL |
192.6±34.3 |
185.70±22.2 |
0.498 |
182.2±33.9 |
187.5±39.3 |
0.176 |
0.353 |
||||||
Triacylglycerol, mg/dL |
75.5(60.2-102.5) |
96.53±35.3 |
0.225 |
68(39.5-96.5) |
73.1±33.3 |
0.684 |
0.241 |
||||||
LDL, mg/dL |
106.2±29.9 |
97.6±31.6 |
0.263 |
107.6±32.5 |
109.9±34.9 |
0.645 |
0.891 |
||||||
HDL, mg/dL |
69.2±12.4 |
72.4±13.3 |
0.942 |
60.1±13.7 |
63.04±13.4 |
0.203 |
0.04 |
||||||
TNF, pg/mL |
5.45±1.87 |
5.31±2.1 |
0.545 |
7.35±3.03 |
7.86±2.7 |
0.951 |
0.03 |
||||||
CRP, μg/mL |
20.39±12.23 |
21.1±13.2 |
0.702 |
11.5±10.6 |
10.6±7.7 |
0.805 |
0.01 |
||||||
Leptin, μg/mL |
18.517±0.0005 |
18.498±0.0005 |
0.340 |
18.505±0.0003 |
18.471±0.0003 |
0.006 |
0.383 |
||||||
T0: Basline characteristics (before the intervention); T1: Final characteristics (after the intervention); BMI: Body Mass Index; BIA: Electrical Bioimpedance; HOMAIR: Homeostatic Model of Iinsulin Resistance; LDL: LDL cholesterol; HDL: HDL cholesterol; TNF: Tumoral Necrosis Factor; CRP: c-Reactive Protein. Data presented as mean ± standard deviation or median (Q1-Q3) according parimetry.Normality test: Kolmogorov- Smirnov, p<0.05 |
|||||||||||||