 |
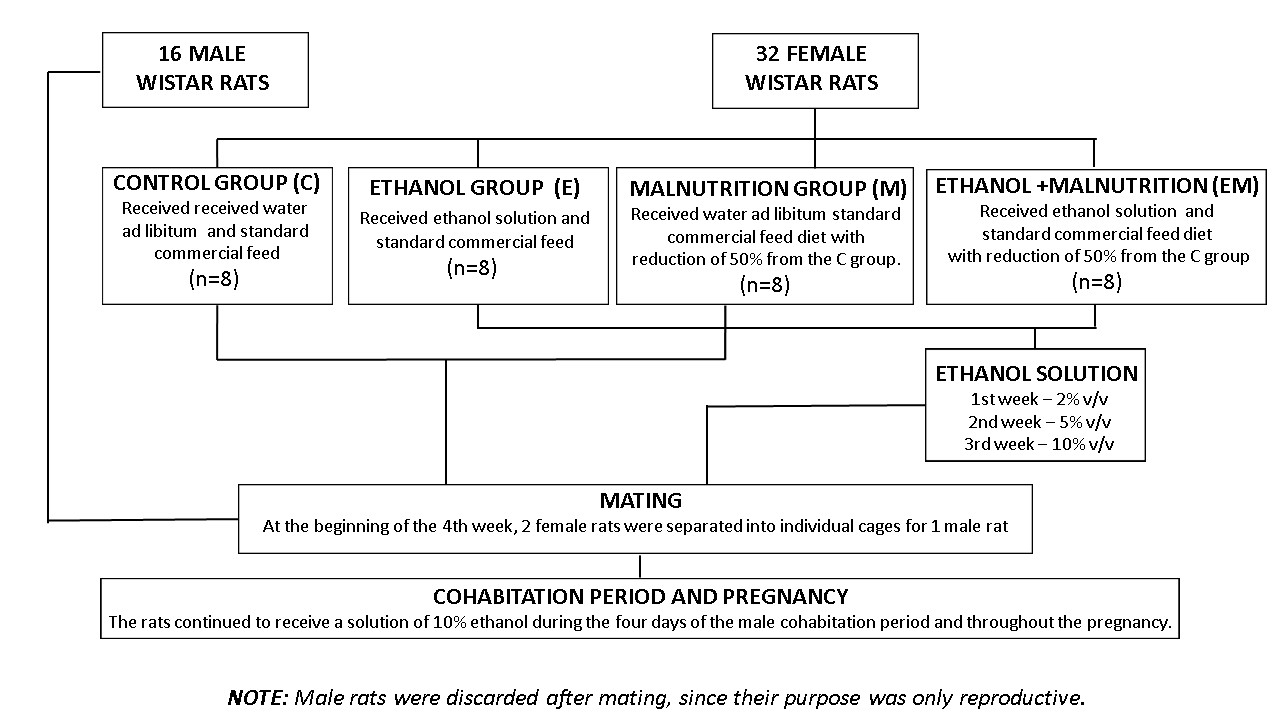
| Figure 1: Methodological strategy Source: elaborated by the authors (2023) |
|
| Figure 1: Methodological strategy Source: elaborated by the authors (2023) |
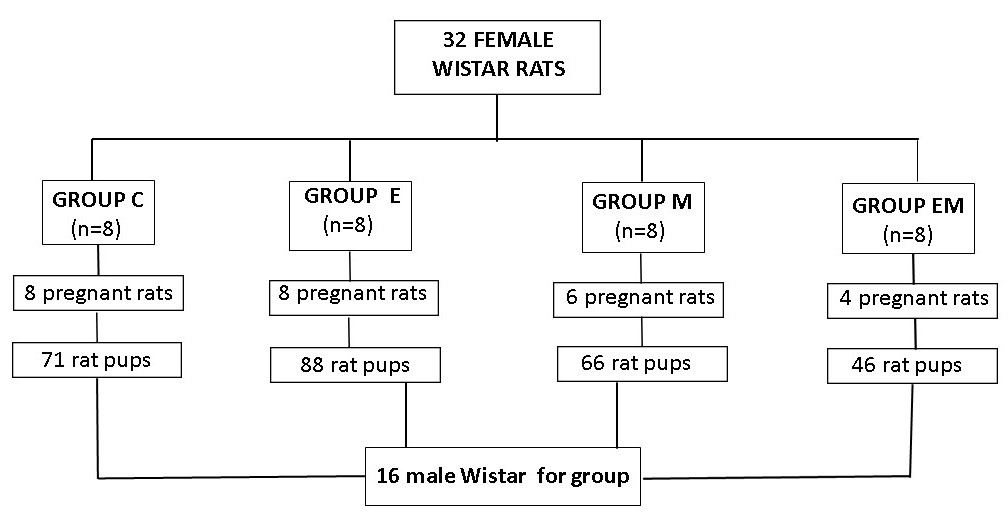 |
| Figure 2: Selection of puppies for research Source:elaborated by the authors (2023) |
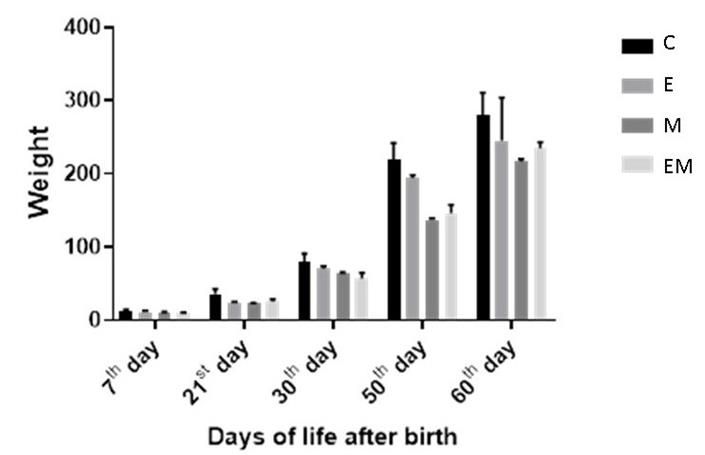 |
| Figure 3: Evolution of offspring weight from 7th to 60th day of life Note:values are means ± SEM. Number of animals per group = 8 |
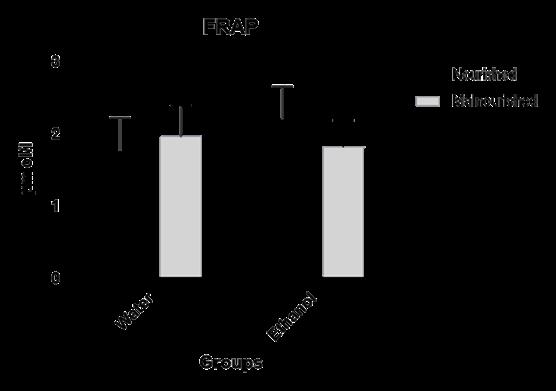 |
| Figure 4: Plasma antioxidant capacity determined by the FRAP method in adult male rats exposed to in utero malnutrition and
ethanol, alone and in association. Note:values are means ± SEM. Number of animals per group = 8 |
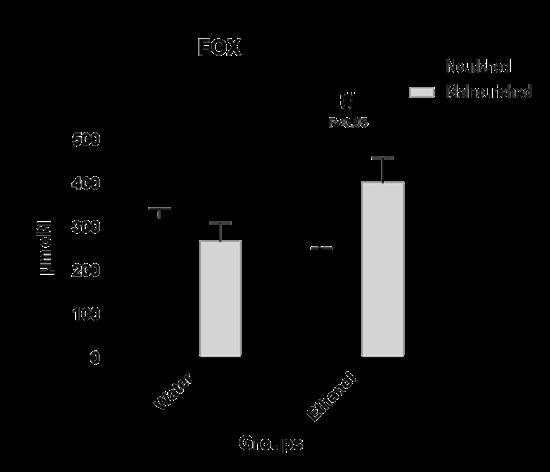 |
| Figure 5: Degree of oxidative stress in offspring of adult male rats exposed to in utero malnutrition and ethanol, alone and in combination. Note:values are means ± SEM. Number of animals per group = 8 |
Period |
Treatment groups |
P-value |
|||
C (n=5) |
M (n=5) |
E (n=5) |
EM (n=5) |
||
Day 0 of pregnancy |
266.2 ± 5.7 |
255.0 ± 35.0 |
267.5 ± 7.3 |
282.3 ± 9.3 |
> 0.05 |
7th day of pregnancy |
275.0 ± 6.7 |
239.3 ± 33.3 |
281.1 ± 6.3 |
257.3 ± 18.2 |
> 0.05 |
14th day of pregnancy |
295.0 ± 8.3 |
225.3 ± 28.6* |
290.5 ± 4.1 |
264.6 ± 20.5 |
< 0.05* |
21st day of pregnancy |
333.0 ± 11.3 |
243.3 ± 24.9* |
332.3 ± 9.2 |
299, 3 ± 24.1 |
< 0.05* |
Period |
Treatment groups |
P-value |
|||
C (n=5) |
M (n=5) |
E (n=5) |
EM (n=5) |
||
th |
23.8 ± 1.0 |
- |
15.3 ± 0.6 * |
- |
< 0.05* |
th |
24.7 ± 1.1 |
- |
16 , 6 ± 0.5 * |
- |
< 0.05* |
st |
26.0 ± 1.2 |
- |
19.0 ± 0.4 * |
- |
< 0.05* |
Period |
Treatment groups |
P-value |
|||
C (n=5) |
M (n=5) |
E (n=5) |
EM (n=5) |
||
th |
33.2 ± 2.2 |
30.3 ± 0.3 |
20.6 ± 2.4 * |
25.0 ± 2.2 * |
< 0.05* |
th |
41.7 ± 3.1 |
35.5 ± 0.5 |
29.5 ± 0.8 * |
31.5 ± 0.9 * |
< 0.05* |
st |
47.0 ± 1.2 |
40.6 ± 2.5 |
29.9 ± 0.8 * |
36.0 ± 3.4 * |
< 0.05* |