 |
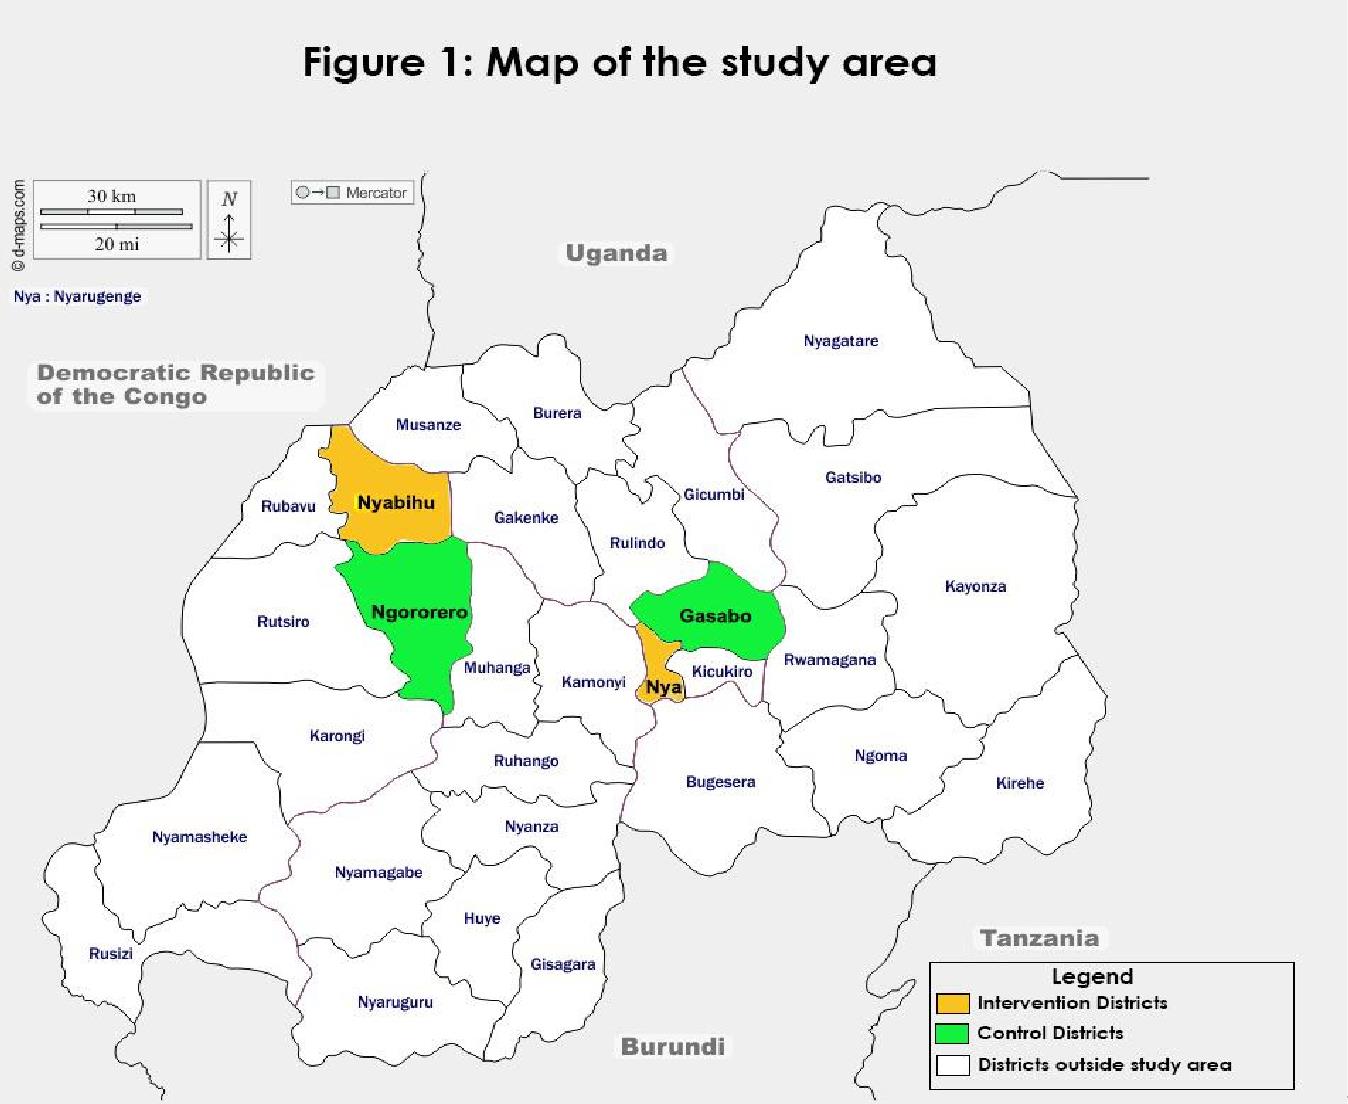
| Figure 1: Map of the Study Area |
|
| Figure 1: Map of the Study Area |
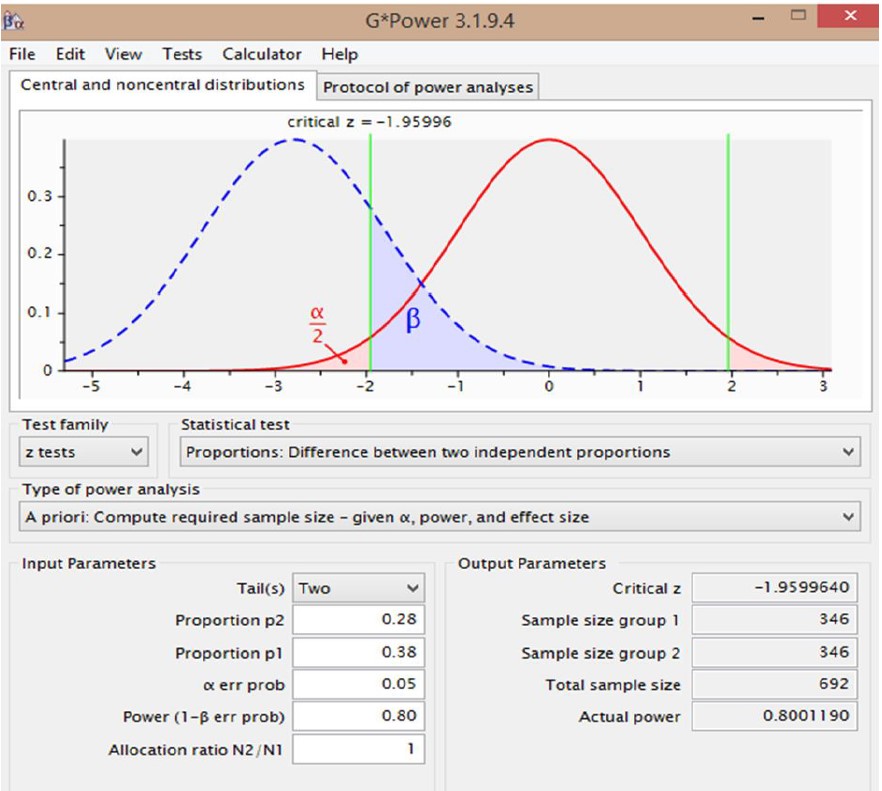 |
| Figure 2: Sample size calculation using G* Power |
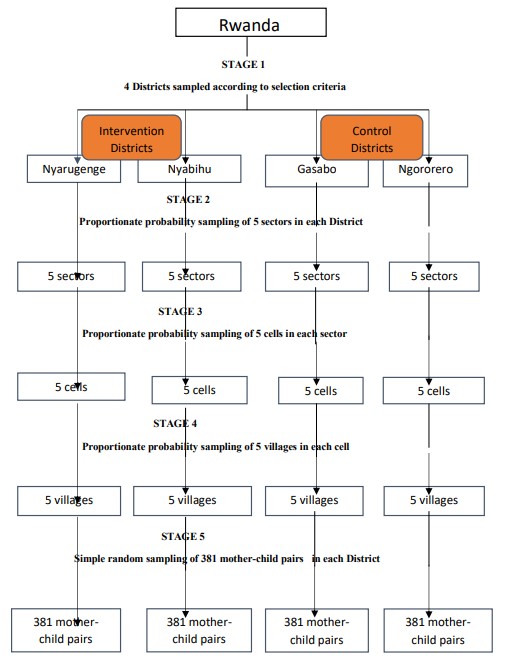 |
| Figure 3: Sample selection |
Characteristics |
Intervention |
Control |
Total(n=1526)%(n) |
χ2 |
p value |
|
|
|
|
|
|
|
|
|
|
|
|
|
|
|
|
|
|
Child’s sex |
|||||
Male |
49.93(381) |
50.46(385) |
50.20(766) |
0.042 |
0.838 |
Female |
50.07(382) |
49.54(378) |
49.80(760) |
|
|
Child's age( in months)<br> |
|||||
41-45 |
34.73(265) |
37.75(288) |
36.24(553) |
2.925 |
0.232 |
46-50 |
47.71 (364) |
47.57(363) |
47.64 (727) |
|
|
51-53 |
17.56 (134) |
14.68 (112) |
16.12 (246) |
|
|
Child’s order/rank among live siblings |
|||||
1-4 |
84.67 (646) |
88.20 (673) |
86.44(1319) |
4.615 |
0.099 |
5-8 |
14.94(114) |
11.27(86) |
13.11(200) |
|
|
9-11 |
0.39(3) |
0.53(4) |
0.45(7) |
|
|
Mother's age( in years) |
|||||
18-25 |
13.37(102) |
13.89(106) |
13.63(208) |
1.084 |
0.581 |
26-35 |
53.21(406) |
55.18(421) |
54.19(827) |
|
|
36 and above |
33.42(255) |
30.93(236) |
32.18(491) |
|
|
Number of family members living in the household |
|
||||
1 ˗5 |
59.11(451) |
66.19(505) |
62.65(956) |
12.757 |
0.002 |
6˗10 |
39.84(304) |
31.72(242) |
35.78 (546) |
|
|
11 ˗13 |
1.05(8) |
2.09(16) |
1.57(24) |
|
|
Mother's marital status |
|||||
Married and cohabiting |
81.65(623) |
76.14(581) |
78.90(1204) |
9.38 |
0.009 |
Single/divorced / widowed |
17.04(130) |
23.07(176) |
20.05(306) |
|
|
Others |
1.31(10) |
0.79(6) |
1.05(16) |
|
|
Mother's education |
|||||
Illiterate |
6.95(53) |
9.04(69) |
7.99(122) |
17.192 |
<.001 |
Primary level |
51.77(395) |
59.77(456) |
55.77(851) |
|
|
Secondary level and above |
41.28(315) |
31.19(238) |
36.24(553) |
|
|
Mother's religion |
|||||
Christian |
88.73(677) |
96.07(733) |
92.40(1410) |
46.531 |
<.001 |
Muslim |
9.04(69) |
1.31(10) |
5.18(79) |
|
|
Others |
2.23(17) |
2.62(20) |
2.42(37) |
|
|
Mother's residence |
|||||
Urban |
59.50(454) |
60.29(460) |
59.89(914) |
0.098 |
0.754 |
Rural |
40.50(309) |
39.71(303) |
40.11(612) |
|
|
Mother's age when she got married |
|||||
15-25 |
82.19(623) |
81.22(614) |
81.71(1237) |
0.443 |
0.801 |
26-35 |
17.28(131) |
18.38(139) |
17.83(270) |
|
|
36 and above |
0.53(4) |
0.40(3) |
0.46(7) |
|
|
Mother's age when she had her first baby |
|||||
15-25 |
76.54(584) |
76.28(582) |
76.41(1166) |
0.121 |
0.942 |
26-35 |
22.67(173) |
23.07(176) |
22.87(349) |
|
|
36 and above |
0.79(6) |
0.65(5) |
0.72(11) |
|
|
Mother's age when she had the current child |
|||||
15-25 |
33.42(255) |
33.95(259) |
33.68(514) |
2.295 |
0.317 |
26-35 |
49.93(381) |
52.16(398) |
51.05(779) |
|
|
36 and above |
16.65(127) |
13.89(106) |
15.27(233) |
|
|
Number of children the mother has given birth to |
|||||
1 ˗5 |
89.25(681) |
91.09(695) |
90.17(1376) |
2.006 |
0.367 |
6˗10 |
10.62(81) |
8.65(66) |
9.63(147) |
|
|
11 and above |
0.13(1) |
(0.26)(2) |
0.20(3) |
|
|
Number of children still alive today |
|||||
1 ˗5 |
91.61(699) |
92.66(707) |
92.14(1406) |
0.588 |
0.745 |
6˗10 |
8.26 (63) |
7.21(55) |
7.73(118) |
|
|
11 and above |
0.13(1) |
0.13(1) |
0.13(2) |
|
|
Number of children under 5 years |
|||||
1˗2 |
98.03(748) |
98.03(748) |
98.03(1496) |
0 |
1 |
3˗5 |
1.97(15) |
1.97(15) |
1.97(30) |
|
|
Birth interval between the current child and the previous birth |
|||||
1 ˗5 |
85.30(534) |
85.74(499) |
85.51(1033) |
0.046 |
0.977 |
6˗10 |
14.70(92) |
14.26(83) |
14.49(175) |
|
|
Gender of head of household |
|||||
Male |
79.42(606) |
72.08(550) |
75.76(1156) |
11.188 |
˂ .001 |
Female |
20.58(157) |
27.92(213) |
24.24(370) |
|
|
Occupation of the mother |
|||||
Farming/agriculture |
37.74(288) |
49.93(381) |
43.84(66)9 |
24.626 |
< .001 |
Self employed |
41.55(317) |
31.32(239) |
(36.44)(556) |
|
|
Salaried employed |
3.54(27) |
3.28(25) |
3.41(52) |
|
|
Unemployed |
17.17(131) |
15.47(118) |
16.32(249) |
|
|
Husband’s education |
|||||
Illiterate |
10.49(80) |
12.06(92) |
11.27(172) |
47.918 |
< .001 |
Primary level |
47.44(362) |
62.52(477) |
54.98(839) |
|
|
Secondary and above |
42.07(321) |
25.42(194) |
33.75(515) |
|
|
Occupation of the father |
|||||
Farming/agriculture |
21.75(166) |
36.57(279) |
29.16(445) |
54.26 |
< .001 |
Self employed |
52.69(402) |
35.91(274) |
44.30(676) |
|
|
Salaried |
12.19(93) |
11.93(91) |
12.06(184) |
|
|
Unemployed |
13.37(102) |
15.59(119) |
14.48(221) |
|
|
Household 's wealth Index |
|||||
Category 1 |
8.26(63) |
11.66(89) |
9.96(152) |
6.815 |
0.033 |
Category 2 |
51.51(393) |
52.82(403) |
52.16(796) |
|
|
Category 3 |
40.23(307) |
35.52(271) |
37.88(578) |
|
|
Characteristics |
Intervention group |
Control group |
Total |
χ2 |
p value |
Initiation of breastfeeding within one hour after birth |
|||||
Yes ( know) |
97.12(741) |
97.51(744) |
97.31(1485) |
0.225 |
0.634 |
No (does not know) |
2.88(22) |
2.49(19) |
2.69(41) |
|
|
Exclusive breastfeeding up to 6 months |
|||||
Yes(Know ) |
96.59(737) |
97.12(741) |
96.85(1478) |
0.344 |
0.557 |
No(does not know ) |
3.41(26) |
2.88(22) |
3.15(48) |
|
|
Continuing breastfeeding for 24 months or more |
|||||
Yes ( know) |
96.07(733) |
96.98(740) |
96.53(1473) |
0.958 |
0.328 |
No( does not know) |
3.93(30) |
3.02(23) |
3.47(53) |
|
|
Initiation of complementary feeding by 6 months |
|||||
Initiation of liquid food at 6 months |
|||||
Yes ( know) |
49.54(378) |
57.54(439) |
53.54(817) |
9.803 |
0.0017 |
No( does not know) |
50.46(385) |
42.46(324) |
46.46(709) |
|
|
Initiation of semi solid food by 7-8 months |
|||||
Yes ( know) |
41.15(314) |
41.55(317) |
41.35(631) |
0.024 |
0.876 |
No( does not know) |
58.85(449) |
58.45(446) |
58.65(895) |
|
|
Initiation of solid food from 9 months |
|||||
Yes(Know ) |
7.86(60) |
20.58(157) |
14.22(217) |
50.55 |
< .001 |
No(does not know) |
92.14(703) |
79.42(606) |
85.78(1309) |
|
|
Having 5 and more groups of food in a day(MDD) |
|||||
Yes(Know) |
5.50(42) |
8.39(64) |
6.95(106) |
4.907 |
0.027 |
No( does not know) |
94.50(721) |
91.61(699) |
93.05(1420) |
|
|
Giving food 3 times a day and more (MMF) |
|||||
Yes ( know) |
96.20(734) |
93.32(712) |
94.76(1446) |
6.385 |
0.012 |
No( does not know) |
3.80(29) |
6.68(51) |
5.24(80) |
|
|
Having 5 and more groups of food and giving food 3 times and more in a day(MAD) |
|||||
Yes(Knows) |
4.85(37) |
7.73(59) |
6.29(96) |
5.381 |
0.021 |
No( does not know) |
95.15(726) |
92.27(704) |
93.71(1430) |
|
|
Micronutrients help our bodies to be in good health and to fight against malnutrition |
|||||
Yes(Knows) |
99.74(761) |
97.25(742) |
98.49(1503) |
15.94 |
< .001 |
No( does not know) |
0.26(2) |
2.75(21) |
1.51(23) |
|
|
Mothers with Comprehensive knowledge on IYCF |
|||||
Yes(Know ) |
3.15(24) |
10.62(81) |
6.88(105) |
|
|
No( Don't know ) |
96.85(739) |
89.38(682) |
93.12(1421) |
33.23 |
< .001 |
Characteristics |
Intervention |
Control |
Total |
χ2 |
p value |
|
|
|
|
|
|
|
|
|
|
|
|
Breastfeeding |
|
|
|
|
|
Yes |
99.34(758) |
99.08(756) |
99.21(1514) |
0.336 |
0.562 |
No |
0.66(5) |
0.92(7) |
0.79(12) |
|
|
Breastfeeding less than 6 months |
|||||
Yes |
0.79(6) |
1.98(15) |
1.39(21) |
3.935 |
0.0472 |
No |
99.21(752) |
98.02(741) |
98.61(1493) |
|
|
Breastfeeding until 24 months |
|||||
Yes |
53.03(402) |
37.17(281) |
45.11(683) |
38.475 |
< 0 .001 |
No |
46.97(356) |
62.83(475) |
54.89(831) |
|
|
Breastfeeding 24 months and more |
|||||
Yes |
83.51(633) |
80.69(610) |
82.10(1243) |
2.05 |
0.152 |
No |
16.49(125) |
19.31(146) |
17.90(271) |
|
|
Initiation of breastfeeding within one hour after birth |
|||||
Yes |
94.46(716) |
91.53(692) |
93.00(1408) |
4.972 |
0.026 |
No |
5.54(42) |
8.47(64) |
7.00(106) |
|
|
Exclusive breastfeeding for 6 months |
|||||
Yes |
92.21(699) |
89.28(675) |
90.75(1374) |
3.871 |
0.049 |
No |
7.79(59) |
10.72(81) |
9.25(140) |
|
|
Initiation of complementary feeding below 6 months |
|||||
Yes |
7.34(56) |
9.04(69) |
8.19(125) |
1.472 |
0.224 |
No |
92.66(707) |
90.96(694) |
91.81(1401) |
|
|
Initiation of complementary feeding at 6 months |
|||||
Yes |
68.55(523) |
64.48(492) |
66.51(1015) |
2.827 |
0.093 |
No |
31.45(240) |
35.52(271) |
33.49(511) |
|
|
Initiation Semi solid foods at 7-8 months |
|||||
Yes |
48.23(368) |
45.48(347) |
46.85(715) |
1.236 |
0.266 |
No |
51.77(395) |
54.52(416) |
53.15(811) |
|
|
Initiation of solid food from 9 months |
|||||
Yes |
9.83(75) |
20.18(154) |
15.01(229) |
32.065 |
< 0.001 |
No |
90.17( 688) |
79.82(609) |
84.99(1297) |
|
|
Appropriate practice of mothers towards IYCF |
|||||
Yes |
53.87(411) |
48.62(371) |
51.25(782) |
4.197 |
0.041 |
No |
46.13(352) |
51.38(392) |
48.75(744) |
|
|
Minimum Dietary Diversity(MDD) |
|||||
Yes |
29.36(224) |
24.77(189) |
27.00(413) |
4.066 |
0.044 |
No |
70.64(539) |
75.23(574) |
73.00(1112) |
|
|
Minimum Meal Frequency( MMF) |
|||||
Yes |
59.76(456) |
52.82(403) |
56.29(859) |
7.481 |
0.006 |
No |
40.24(307) |
47.18(360) |
43.71(667) |
|
|
Minimum Acceptable Diet (MAD) |
|||||
Yes |
23.33(178) |
18.09(138) |
20.71(316) |
6.386 |
0.011 |
No |
76.67(585) |
81.91(625) |
79.29(1210) |
|
|
Intervention group |
Control group |
||||||||||
Variables |
Yes |
No |
Total |
χ2 |
P value |
Yes |
No |
Total |
χ2 |
P value |
|
|
|
|
|
|
|
|
|
|
|
|
|
Child’s sex |
|
|
|
|
|
|
|
|
|
||
Female |
52.9(202) |
47.1(180) |
100.0(382) |
0.3 |
0.584 |
48.1(182) |
51.9(196) |
100.0(378) |
0.068 |
0.794 |
|
Male |
54.9(209) |
45.1(172) |
100.0(381) |
|
|
49.1(189) |
50.9(196) |
100.0(385) |
|
|
|
Child's age(months) |
|||||||||||
41-45 |
54.7(145) |
45.3(120) |
100.0(265) |
0.391 |
0.823 |
48.6(140) |
51.4(148) |
100.0(288) |
0.013 |
0.993 |
|
46-50 |
54.1(197) |
45.9(167) |
100.0(364) |
|
|
48.5(176) |
51.5(187) |
100.0(363) |
|
|
|
51-53 |
51.5(69) |
48.5(65) |
100.0(134) |
|
|
49.1(55) |
50.9(57) |
100.0(112) |
|
|
|
Number of family members |
|||||||||||
1 ˗5 |
52.5(237) |
47.5(214) |
100.0(451) |
1.991 |
0.37 |
50.3(254) |
49.7(251) |
100.0(505) |
1.821 |
0.402 |
|
6˗10 |
55.3(168) |
44.7(136) |
100.0(304) |
|
|
45.0(109) |
55.0(133) |
100.0(242) |
|
|
|
11 ˗13 |
75.0(6) |
25.0(2) |
100.0(8) |
|
|
50.0(8) |
50.0(8) |
100.)(16) |
|
|
|
Child's order/rank among live siblings |
|||||||||||
1 ˗4 |
53.1(343) |
46.9(303) |
100.0(646) |
3.179 |
0.204 |
48.4(326) |
51.6(347) |
100.0(673) |
0.077 |
0.962 |
|
5˗8 |
57.0(65) |
43.0(49) |
100.09114) |
|
|
50.0(43) |
50.0(43) |
100.0(86) |
|
|
|
9 ˗11 |
100.0(3) |
0.0(0) |
100.0(3) |
|
|
50.0(2) |
50.0(2) |
100.0(4) |
|
|
|
Age of the mother (years) |
|||||||||||
18-25 |
45.1(46) |
54.9(56) |
100.0(102) |
6.311 |
0.043 |
35.8(38) |
64.2(68) |
100.0(106) |
8.111 |
0.017 |
|
26-35 |
52.7(214) |
47.3(192) |
100.0(406) |
|
|
51.1(215) |
48.9(206) |
100.0(421) |
|
|
|
36 and above |
59.2(151) |
40.8(104) |
100.0(255) |
|
|
50.0(118) |
50.0(118) |
100.0(236) |
|
|
|
Marital status of the mother |
|||||||||||
Married and cohabitation |
55.7(347) |
44.3(276) |
100..0(623) |
5.47 |
0.065 |
50.3(292) |
49.7(289) |
100.0(581) |
2.856 |
0.24 |
|
Single/Divorced/Widowed |
44.6(58) |
55.4(72) |
100.0(130) |
|
|
43.8(77) |
56.2(99) |
100.0(176) |
|
|
|
Others |
60.0(6) |
40.0(4) |
100.0(10) |
|
|
33.3(2) |
66.7(4) |
100.0(6) |
|
|
|
Mother's education |
|||||||||||
Illiterate |
58.5(31) |
41.5(22) |
100.0(53) |
5.379 |
0.068 |
56.5(39) |
43.5(30) |
100.0(69) |
1.928 |
0.381 |
|
Primary level |
57.2(226) |
42.8(169) |
100.0(395) |
|
|
47.6(217) |
52.4(239) |
100.0(456) |
|
|
|
Secondary level and above |
48.9(154) |
51.1(161) |
100.0(315) |
|
|
48.3(115) |
51.7(123) |
100.0(238) |
|
|
|
Religion of the mother |
|||||||||||
Christian |
53.2(360) |
46.8(317) |
100.0(677) |
1.498 |
0.473 |
48.6(356) |
51.4(377) |
100.0(733) |
0.024 |
0.988 |
|
Muslim |
60.9(42) |
39.1(27) |
100.0(69) |
|
|
50.0(5) |
50.0(5) |
100.0(10) |
|
|
|
Others |
52.9(9) |
47.1(8) |
100.0(17) |
|
|
50.0(10) |
50.0(10) |
100.0920) |
|
|
|
Place of the residence |
|||||||||||
Rural |
57.0(176) |
43.0(133) |
100.0(309) |
1.997 |
0.158 |
59.4(180) |
40.6(123) |
100.0(303) |
23.39 |
0 |
|
Urban |
51.8(235) |
48.2(219) |
100.0(454) |
|
|
41.5(191) |
58.5(269) |
100.0(460) |
|
|
|
Mother's age when got married |
|||||||||||
15-25 |
54.7(341) |
45.3(282) |
100.0(623) |
1.857 |
0.395 |
49.3(303) |
50.7(311) |
100.0(614) |
0.531 |
0.767 |
|
26-35 |
49.6(65) |
50.4(66) |
100.0(131) |
|
|
47.5(66) |
52.5(73) |
100.0(139) |
|
|
|
36 and above |
75.0(3) |
25.0(1) |
100.0(4) |
|
|
66.7(2) |
33.3(1) |
100.0(3) |
|
|
|
Mother's age first baby |
|||||||||||
15-25 |
53.8(314) |
46.2(270) |
100.0(584) |
0.054 |
0.974 |
48.6(283) |
51.4(299) |
100.0(582) |
2.027 |
0.363 |
|
26-35 |
54.3(94) |
45.7(79) |
100.0(173) |
|
|
47.7(84) |
52.3(92) |
100.0(176) |
|
|
|
36 and above |
50.0(3) |
50.0(3) |
100.0(6) |
|
|
80.0(4) |
20.0(1) |
100.0(5) |
|
|
|
Mother's age current baby |
|||||||||||
15-25 |
45.5(116) |
54.5(139) |
100.0(255) |
10.94 |
0.004 |
48.3(125) |
51.7(134) |
100.0(259) |
2.542 |
0.28 |
|
26-35 |
58.5(223) |
41.5(158) |
100.0(381) |
|
|
47.0(187) |
53.0(211) |
100.0(398) |
|
||
36 and above |
56.7(72) |
43.3(55) |
100.0(127) |
|
55.7(59) |
44.3(47) |
100.0(106) |
|
|||
Number of children given birth to |
|||||||||||
1 ˗5 |
54.9(368) |
46.0(313) |
100.0(681) |
0.997 |
0.607 |
48.9(340) |
51.1(355) |
100.0(695) |
0.291 |
0.864 |
|
6˗10 |
51.9(42) |
48.1(39) |
100.0(81) |
|
|
45.5(30) |
54.5(36) |
100.0(66) |
|
|
|
11 and above |
100.0(1) |
0.0(0) |
100.0(1) |
|
|
50.0(1) |
50.0(1) |
100.0(2) |
|
|
|
Number of children under 5 years |
|||||||||||
1 ˗2 |
54.7(409) |
45.3(339) |
100.0(748) |
10.12 |
0.001 |
49.3(369) |
50.7(379) |
100.0(748) |
7.628 |
0.006 |
|
3˗5 |
13.3(2) |
86.7(13) |
100.0(15) |
|
|
13.3(2) |
86.7(13) |
100.0(15) |
|
|
|
Birth interval with the previous birth |
|||||||||||
1 ˗5 |
53.9(288) |
46.1(246) |
100.0(534) |
0.794 |
0.373 |
47.9(239) |
52.1(260) |
100.0(499) |
0.436 |
0.509 |
|
6˗10 |
48.9(45) |
51.1(47) |
100.0(92) |
|
|
51.8(43) |
48.2(40) |
100.0(83) |
|
|
|
Number of children alive today |
|||||||||||
1 ˗5 |
54.4(380) |
45.6(319) |
100.0(699) |
1.915 |
0.384 |
48.7(344) |
51.3(363) |
100.0(707) |
1.097 |
0.578 |
|
6˗10 |
47.6(30) |
52.4(33) |
100.0(63) |
|
|
47.3(26) |
52.7(29) |
100.0(55) |
|
|
|
11 and above |
100.0(1) |
0.0(0) |
100.0(1) |
|
|
100.0(1) |
0.0(0) |
100.0(1) |
|
|
|
Gender of the Head of household |
|||||||||||
Female |
47.8(75) |
52.2(82) |
100.0(157) |
2.956 |
0.086 |
44.6(95) |
55.4(118) |
100.0(213) |
1.914 |
0.166 |
|
Male |
55.4(336) |
44.6(270) |
100.0(606) |
|
|
50.2(276) |
49.8(274) |
100.0(550) |
|
|
|
Occupation of the mother |
|||||||||||
Farming/agriculture |
59.4(171) |
40.6(117) |
100.0(288) |
6.038 |
0.11 |
56.7(216) |
43.3(165) |
100.0(381) |
24.63 |
0 |
|
Self employed |
49.5(157) |
50.5(160) |
100.0(317) |
|
|
44.4(106) |
55.6(133) |
100.0(239) |
|
|
|
Salaried employed |
51.9(14) |
48.1(13) |
100.0(27) |
|
|
44.0(11) |
56.0(14) |
100.0(25) |
|
|
|
Unemployed |
52.7(69) |
47.3(62) |
100.0(131) |
|
|
32.2(38) |
67.8(80) |
100.0(118) |
|
|
|
Husband's education |
|||||||||||
Illiterate |
52.5(42) |
47.5(38) |
100.0(80) |
1.043 |
0.594 |
52.2(48) |
47.8(44) |
100.0(92) |
1.37 |
0.504 |
|
Primary level |
55.8(202) |
44.2(160) |
100.0(362) |
|
|
49.3(235) |
50.7(242) |
100.0(477) |
|
|
|
Secondary level and above |
52.0(167) |
48.0(154) |
100.0(321) |
|
|
45.4(88) |
54.6(106) |
100.0(194) |
|
|
|
Occupation of the father |
|||||||||||
Farming/agriculture |
57.8(96) |
42.2(70) |
100.0(166) |
6.746 |
0.08 |
62.4(174) |
37.6(105) |
100.0(279) |
33.3 |
0 |
|
Self employed |
55.7(224) |
44.3(178) |
100.0(402) |
|
|
40.5(111) |
59.5(163) |
100.0(274) |
|
|
|
Salaried employed |
50.5(47) |
49.5(46) |
100.0(93) |
|
|
41.8(38) |
58.2(53) |
100.0(91) |
|
|
|
Unemployed |
43.1(44) |
56.9(58) |
100.0(102) |
|
|
40.3(48) |
59.7(71) |
100.0(119) |
|
|
|
Wealth index |
|||||||||||
Category 1 |
42.9(27) |
57.1(36) |
100.0(63) |
7.66 |
0.022 |
50.6(45) |
49.4(44) |
100.0(89) |
0.75 |
0.687 |
|
Category 2 |
51.4(202) |
48.6(191) |
100.0(307) |
|
|
47.1(190) |
52.9(213) |
100.0(403) |
|
|
|
Category 3 |
59.3(182) |
40.7(125) |
100.0(307) |
|
|
50.2(136) |
49.8(135) |
100.0(271) |
|
|
|
Comprehensive knowledge on IYCF |
|||||||||||
No |
53.5(395) |
46.5(344) |
100.0(739) |
1.634 |
0.201 |
46.9(320) |
53.1(362) |
100.0(682) |
7.459 |
0.006 |
|
Yes |
66.7(16) |
33.3(8) |
100.0(24) |
|
|
63.0(51) |
37.0(30) |
100.0(81) |
|
|
|
|
|
|
|
|
|
|
|
|
Control group |
|
|
|
|
|||||||||||||||||||||||||||||||||
|
|
|
|
|
|
p |
|
|
p |
|
|
|
|
|
|
|
p |
|
|
p |
||||||||||||||||||||||||||
Variables |
Yes |
No |
Total |
COR |
CI at 95% |
value |
AOR |
CI at 95% |
value |
Yes |
No |
|
Total |
|
COR |
CI at 95% |
value |
AOR |
|
CI at 95% |
|
value |
||||||||||||||||||||||||
|
%(n) |
%(n) |
%(n) |
|
|
|
|
|
|
%(n) |
%(n) |
|
%(n) |
|
|
|
|
|
|
|
|
|
||||||||||||||||||||||||
|
|
|
|
|
|
|
|
|
|
|
|
|
|
|
|
|
|
|
|
|
|
|
||||||||||||||||||||||||
Age of the mother (years) |
|
|
|
|
|
|
|
|
|
|
|
|
|
|||||||||||||||||||||||||||||||||
|
|
|
|
|
|
|
|
|
|
|
|
|
|
|
|
|
||||||||||||||||||||||||||||||
18-25 |
|
45.1(46) |
|
54.9(56) |
|
100.0(102) |
1 |
|
|
1 |
|
|
35.8(38) |
64.2(68) |
|
100.0(106) |
|
1 |
|
|
1 |
|
|
|
|
|||||||||||||||||||||
26-35 |
|
52.7(214) |
|
47.3(192) |
|
100.0(406) |
1.357 |
0.877-2.098 |
0.170 |
0.996 |
0.600-1.652 |
0.987 |
51.1(215) |
48.9(206) |
|
100.0(421) |
|
1.868 |
1.202-2.902 |
0.005 |
1.969 |
|
1.227- 3.159 |
|
0.005 |
|||||||||||||||||||||
36 and above |
|
59.2(151) |
|
40.8(104) |
|
100.0(255) |
1.768 |
1.112-2.809 |
0.016 |
1.215 |
0.634-2.330 |
0.558 |
50.0(118) |
50.0(118) |
|
100.0(236) |
|
1.789 |
1.116-2.869 |
0.016 |
1.557 |
|
0.933-2.600 |
|
0.090 |
|||||||||||||||||||||
Mother's age current baby |
|
|
|
|
|
|
|
|
|
|
|
|
|
|||||||||||||||||||||||||||||||||
15-25 |
45.5(116) |
54.5(139) |
100.0(255) |
1 |
|
|
1 |
|
|
|
|
|
|
|
|
|
|
|
|
|
|
|
||||||||||||||||||||||||
26-35 |
58.5(223) |
41.5(158) |
100.0(381) |
1.691 |
1.228-2.329 |
0.001 |
1.549 |
1.041-2.305 |
0.031 |
|
|
|
|
|
|
|
|
|
|
|
|
|
||||||||||||||||||||||||
36 and above |
56.7(72) |
43.3(55) |
100.0(127) |
1.569 |
1.022-2.409 |
0.040 |
1.196 |
0.638-2.241 |
0.578 |
|
|
|
|
|
|
|
|
|
|
|
|
|
||||||||||||||||||||||||
Number of children under 5 years |
|
|
|
|
|
|
|
|
|
|
|
|
|
|||||||||||||||||||||||||||||||||
1-2 |
54.7(409) |
45.3(339) |
100.0(748) |
7.842 |
1.757-34.993 |
0.007 |
8.135 |
1.808-36.603 |
0.006 |
49.3(369) |
50.7(379) |
|
100.0(748) |
|
6.328 |
1.418- |
0.016 |
6.329 |
|
1.377-29.089 |
|
0.018 |
||||||||||||||||||||||||
3-5 |
13.3(2) |
86.7(13) |
100.0(15) |
1 |
|
|
1 |
|
|
13.3(2) |
86.7(13) |
|
100.0(15) |
|
1 |
|
|
1 |
|
|
|
|
||||||||||||||||||||||||
Wealth index |
|
|
|
|
|
|
|
|
|
|
|
|
|
|
|
|
|
|
|
|
|
|
||||||||||||||||||||||||
Category 1 |
42.9(27) |
57.1(36) |
100.0(63) |
1 |
|
|
1 |
|
|
|
|
|
|
|
|
|
|
|
|
|
|
|
||||||||||||||||||||||||
Category 2 |
51.4(202) |
48.6(191) |
100.0(307) |
1.410 |
0.824-2.412 |
0.210 |
1.410 |
0.818-2.430 |
0.216 |
|
|
|
|
|
|
|
|
|
|
|
|
|
||||||||||||||||||||||||
Category 3 |
59.3(182) |
40.7(125) |
100.0(307) |
1.941 |
1.122-3.360 |
0.018 |
1.792 |
1.026-3.130 |
0.040 |
|
|
|
|
|
|
|
|
|
|
|
|
|
||||||||||||||||||||||||
Occupation of the mother |
|
|
|
|
|
|
|
|
|
|
|
|
|
|||||||||||||||||||||||||||||||||
Farming/agriculture |
|
|
|
|
|
|
|
|
56.7(216) |
43.3(165) |
|
100.0(381) |
|
2.756 |
1.782-4.263 |
0.000 |
1.489 |
|
0.861-2.578 |
|
0.155 |
|||||||||||||||||||||||||
Self employed |
|
|
|
|
|
|
|
|
|
44.4(106) |
55.6(133) |
|
100.0(239) |
|
1.678 |
1.056-2.665 |
0.028 |
1.686 |
|
1.046-2.717 |
|
0.032 |
||||||||||||||||||||||||
Salaried employed |
|
|
|
|
|
|
|
|
|
44.0(11) |
56.0(14) |
|
100.0(25) |
|
1.654 |
0.687-3.984 |
0.262 |
1.315 |
|
0.520-3.329 |
|
0.563 |
||||||||||||||||||||||||
Unemployed |
|
|
|
|
|
|
|
|
|
32.2(38) |
67.8(80) |
|
100.0(118) |
|
1 |
|
|
1 |
|
|
|
|
||||||||||||||||||||||||
Occupation of the father |
|
|
|
|
|
|
|
|
|
|
|
|
|
|||||||||||||||||||||||||||||||||
Farming/agriculture |
|
|
|
|
|
|
|
|
56.7(216) |
43.3(165) |
|
100.0(381) |
|
2.451 |
1.580-3.803 |
0.000 |
1.841 |
|
1.060-3.197 |
|
0.030 |
|||||||||||||||||||||||||
Self employed |
|
|
|
|
|
|
|
|
|
44.4(106) |
55.6(133) |
|
100.0(239) |
|
1.007 |
0.650-1.562 |
0.974 |
0.939 |
|
0.589-1.498 |
|
0.793 |
||||||||||||||||||||||||
Salaried employed |
|
|
|
|
|
|
|
|
|
44.0(11) |
56.0(14) |
|
100.0(25) |
|
1.061 |
0.609-1.847 |
0.835 |
0.849 |
|
0.463-1.557 |
|
0.597 |
||||||||||||||||||||||||
Unemployed |
|
|
|
|
|
|
|
|
|
32.2(38) |
67.8(80) |
|
100.0(118) |
|
1 |
|
|
1 |
|
|
|
|
||||||||||||||||||||||||
Comprehensive knowledge on IYCF |
|
|
|
|
|
|
|
|
|
|
|
|
|
|||||||||||||||||||||||||||||||||
No |
|
|
|
|
|
|
|
|
|
46.9(320) |
53.1(362) |
|
100.0(682) |
|
1 |
|
|
1 |
|
|
|
|
||||||||||||||||||||||||
Yes |
|
|
|
|
|
|
|
|
|
63.0(51) |
37.0(30) |
|
100.0(81) |
|
1.923 |
1.196-3.094 |
0.007 |
2.374 |
|
1.420-3.968 |
|
0.001 |
||||||||||||||||||||||||
Place of the residence |
|
|
|
|
|
|
|
|
|
|
|
|
|
|||||||||||||||||||||||||||||||||
Rural |
|
|
|
|
|
|
|
|
|
59.4(180) |
40.6(123) |
|
100.0(303) |
|
2.061 |
1.535-2.768 |
0.000 |
1.435 |
|
0.953-2.161 |
|
0.084 |
||||||||||||||||||||||||
Urban |
|
|
|
|
|
|
|
|
|
41.5(191) |
58.5(269) |
|
100.0(460) |
|
1 |
|
|
1 |
|
|
|
|
||||||||||||||||||||||||
Intervention group |
p |
Control group |
p |
|||||||
Variables |
Yes |
No |
Total |
χ2 |
P value |
Yes |
No |
Total |
χ2 |
P value |
|
|
|
|
|
|
|
|
|
|
|
Child’s sex |
|
|||||||||
Female |
27.2(104) |
72.8(278) |
100.0(382) |
6.492 |
0.011 |
17.2(65) |
82.8(313) |
100.0(378) |
0.401 |
0.526 |
Male |
19.4(74) |
80.6(307) |
100.0(381) |
|
|
19.0(73) |
81.0(312) |
100.0(385) |
|
|
Child's age(months) |
||||||||||
41-45 |
30.2(80) |
69.8(185) |
100.0(265) |
18.06 |
0 |
19.4(56) |
80.6(232) |
100.0(288) |
7.943 |
0.019 |
46-50 |
22.8(83) |
77.2(281) |
100.0(364) |
|
|
14.6(53) |
85.4(310) |
100.0(363) |
|
|
51-53 |
11.2(15) |
88.8(119) |
100.0(134) |
|
|
29.9(29) |
74.1(83) |
100.0(112) |
|
|
Number of family members |
||||||||||
1 ˗5 |
23.9(108) |
76.1(343) |
100.0(451) |
0.266 |
0.876 |
18.8(95) |
81.2(410) |
100.0(505) |
1.33 |
0.514 |
6˗10 |
22.4(68) |
77.6(236) |
100.0(304) |
|
16.1(39) |
83.9(203) |
100.0(242) |
|
|
|
11 ˗13 |
25.0(2) |
75.0(6) |
100.0(8) |
|
|
25.0(4) |
75.0(12) |
100.0(16) |
|
|
Child's order/rank among live siblings |
||||||||||
1 ˗4 |
23.7(153) |
76.3(493) |
100.0(646) |
1.083 |
0.582 |
18.6(125) |
81.4(548) |
100.0(673) |
1.228 |
0.541 |
5˗8 |
21.9(25) |
78.1(89) |
100.0(114) |
|
|
14.0(12) |
86.0(74) |
100.0(86) |
|
|
9 ˗11 |
0.0(0) |
100.0(3) |
100..0(3) |
|
|
25.0(1) |
75.0(3) |
100.0(4) |
|
|
Age of the mother (years) |
||||||||||
18-25 |
24.5(25) |
75.5(77) |
100.0(102) |
0.231 |
0.891 |
11.3(12) |
88.7(94) |
100.0(106) |
9.463 |
0.009 |
26-35 |
22.7(92) |
77.3(314) |
100.0(406) |
|
|
21.9(92) |
78.1(329) |
100.0(421) |
|
|
36 and above |
23.9(61) |
76.1(194) |
100.0(255) |
|
|
14.4(34) |
85.6(202) |
100.0(236) |
|
|
Marital status of the mother |
||||||||||
Married and cohabitation |
24.6(153) |
75.4(470) |
100.0(623) |
2.898 |
0.235 |
20.3(118) |
79.7(463) |
100.0(581) |
8.262 |
0.016 |
Single/Divorced/Widowed |
17.7(23) |
82.3(107) |
100.0(130) |
|
|
10.8(19) |
89.2(157) |
100.0(176) |
|
|
Others |
20.0(2) |
80.0(8) |
100.0(10) |
|
|
16.7(1) |
83.3(5) |
100.0(6) |
|
|
Mother's education |
||||||||||
Illiterate |
11.3(6) |
88.7(47) |
100.0(53) |
24.04 |
0 |
7.2(5) |
92.8(64) |
100.0(69) |
63.171 |
0 |
Primary level |
18.0(71) |
82.0(324) |
100.0(395) |
|
|
11.2(51) |
88.8(405) |
100.0(456) |
|
|
Secondary level |
32.1(101) |
67.9(214) |
100.0(315) |
|
|
34.5(82) |
65.5(156) |
100.0(238) |
|
|
Mother's religion |
||||||||||
Christian |
23.8(161) |
76.2(516) |
100.0(677) |
2.971 |
0.226 |
17.9(131) |
82.1(602) |
100.0(733) |
3.393 |
0.183 |
Muslim |
23.2(16) |
76.8(53) |
100.0(69) |
|
|
40.0(4) |
60.0(6) |
100.0(10) |
|
|
Others |
5.9(1) |
94.1(16) |
100.0(17) |
|
|
15.0(3) |
85.0(17) |
100.0(20) |
|
|
Place of the residence |
||||||||||
Rural |
17.5(54) |
82.5(255) |
100.0(309) |
9.947 |
0.002 |
12.9(39) |
87.1(264) |
100.0(303) |
9.227 |
0.002 |
Urban |
27.3(124) |
72.7(330) |
100.0(454) |
|
|
21.5(99) |
78.5(361) |
100.0(460) |
|
|
Mother's age when got married |
||||||||||
15-25 |
22.2(138) |
77.8(485) |
100.0(623) |
3.503 |
0.174 |
16.3(100) |
83.7(514) |
100..0(614) |
8.567 |
0.014 |
26-35 |
29.8(39) |
70.2(92) |
100.0(131) |
|
|
26.6(37) |
73.4(102) |
100.0(139) |
|
|
36 and above |
25.0(1) |
75.0(3) |
100.(94) |
|
|
33.3(1) |
66.7(2) |
100.0(3) |
|
|
Mother's age first baby |
||||||||||
15-25 |
22.8(133) |
77.2(451) |
100.0(584) |
0.662 |
0.718 |
16.5(96) |
83.5(486) |
100.0(582) |
6.064 |
0.048 |
26-35 |
24.9(43) |
75.1(130) |
100.0(173) |
|
|
23.9(42) |
76.1(134) |
100.0(176) |
|
|
36 and above |
33.3(2) |
66.7(4) |
100.0(6) |
|
|
0.0(0) |
100.0(5) |
100.0(5) |
|
|
Mother's age current baby |
||||||||||
15-25 |
22.4(57) |
77.6(198) |
100.0(255) |
0.208 |
0.901 |
19.3(50) |
80.7(209) |
100.0(259) |
9.297 |
0.01 |
26-35 |
23.9(91) |
76.1(290) |
100.0(381) |
|
|
20.1(80) |
79.9(318) |
100.0(398) |
|
|
36 and above |
23.6(30) |
76.4(97) |
100.0(127) |
|
|
7.5(8) |
92.5(98) |
100.0(106) |
|
|
Number of children given birth to |
||||||||||
1 ˗5 |
23.6(161) |
76.4(520) |
100.0(681) |
0.59 |
0.745 |
18.3(127) |
81.7(568) |
100.0(695) |
1.775 |
0.412 |
6˗10 |
21.0(17) |
79.0(64) |
100.0(81) |
|
|
15.2(10) |
84.8(56) |
100.0(66) |
|
|
11 and above |
0.0(0) |
100.0(1) |
100.0(1) |
|
|
50.0(1) |
50.0(1) |
100.0(2) |
|
|
Number of children under 5 years |
||||||||||
1 ˗2 |
23.0(172) |
77.0(576) |
100.0(748) |
|
18.0(135) |
82.0(613) |
100.0(748) |
0.038 |
0.846 |
|
3˗5 |
40.0(6) |
60.0(9) |
100.0(15) |
2.377 |
0.123 |
20.0(3) |
80.0(12) |
100.0(15) |
|
|
Birth interval with the previous birth |
||||||||||
1 ˗5 |
23.6(126) |
76.4(408) |
100.0(534) |
0.382 |
0.537 |
17.4(87) |
82.6(412) |
100.0(499) |
0.02 |
0.888 |
6˗10 |
20.7(19) |
79.3(73) |
100.0(92) |
|
|
18.1(15) |
81.9(68) |
100.0(83) |
|
|
Number of children alive today |
||||||||||
1 ˗5 |
23.5(164) |
76.5(535) |
100.0(699) |
0.345 |
0.838 |
18.1(128) |
81.9(579) |
100.0(707) |
0.221 |
0.895 |
6˗10 |
22.2(14) |
77.8(49) |
100.063) |
|
|
18.2(10) |
81.8(45) |
100.0(55) |
|
|
11 and above |
0.0(0) |
100.0(1) |
100.(91) |
|
|
0.0(0) |
100.0(1) |
100.0(1) |
|
|
Gender of the Head of household |
||||||||||
Female |
12.7(20) |
87.3(137) |
100.0(157) |
12.39 |
0 |
13.6(29) |
86.4(184) |
100.0(213) |
3.988 |
0.046 |
Male |
26.1(158) |
73.9(448) |
100.0(606) |
|
|
19.8(109) |
80.2(441) |
100.0(550) |
|
|
Occupation of the mother |
||||||||||
Farming/agriculture |
20.5(59) |
79.5(229) |
100.0(288) |
3.672 |
0.299 |
11.5(44) |
88.5(337) |
100.0(381) |
41.53 |
0 |
Self employed |
23.7(75) |
76.3(242) |
100.0(317) |
|
|
20.5(49) |
79.5(190) |
100.0(239) |
|
|
Salaried employed |
33.3(9) |
66.7(18) |
100.0(27) |
|
|
56.0(14) |
44.0(11) |
100.0(25) |
|
|
Unemployed |
26.7(35) |
73.3(96) |
100.0(131) |
|
|
26.3(31) |
73.7(87) |
100.0(118) |
|
|
Husband's education |
||||||||||
Illiterate |
6.3(5) |
93.8(75) |
100.0(80) |
23.731 |
0 |
5.4(5) |
94.6(87) |
100.0(92) |
76.675 |
0 |
Primary level |
20.7(75) |
79.3(287) |
100.0(362) |
|
|
12.2(58) |
87.8(419) |
100.0(477) |
|
|
Secondary level |
30.5(98) |
69.5(223) |
100.0(321) |
|
|
38.7(75) |
61.3(119) |
100.0(194) |
|
|
Occupation of the father |
||||||||||
Farming/agriculture |
17.5(29) |
82.5(137) |
100.0(166) |
17.64 |
0.001 |
9.3(26) |
90.7(253) |
100.0(279) |
84.53 |
0 |
Self employed |
22.4(90) |
77.6(312) |
100.(402) |
|
|
17.2(47) |
82.8(227) |
100.0(274) |
|
|
Salaried employed |
39.8(37) |
60.2(56) |
100.0(93) |
|
|
51.6(47) |
48.4(44) |
100.0(91) |
|
|
Unemployed |
21.6(22) |
78.4(80) |
100.0(102) |
|
|
15.1(18) |
84.9(101) |
100.0(119) |
|
|
Wealth index |
||||||||||
Category 1 |
15.9(10) |
84.1(53) |
100.0(63) |
3.43 |
0.18 |
7.9(7) |
92.1(82) |
100.0(89) |
9.994 |
0.007 |
Category 2 |
22.4(88) |
77.6(305) |
100.0(393) |
|
|
17.4(70) |
82.6(333) |
100.0(403) |
|
|
Category 3 |
26.1(80) |
73.9(227) |
100.0(307) |
|
|
22.5(61) |
77.5(210) |
100.0(271) |
|
|
Comprehensive knowledge on IYCF |
||||||||||
No |
23.3(172) |
76.7(567) |
100.0(739) |
0.039 |
0.844 |
17.4(119) |
82.6(563) |
100.0(682) |
1.764 |
0.184 |
Yes |
25.0(6) |
75.0(18) |
100.0(24) |
|
|
23.5(19) |
76.5(62) |
100.0(81) |
|
|
Intervention group |
Control group |
|||||||||||||||||
Variables |
Yes |
No |
Total |
Cor |
CI at 95% |
p value |
AOR |
CI at 95% |
p value |
Yes |
No |
Total |
Cor |
CI at 95% |
p value |
Aor |
CI at 95% |
p value |
Child’s sex |
|
|
|
|
|
|
|
|
|
|
|
|
|
|
|
|
|
|
Female |
27.2 |
72.8 |
100.0 |
1.5 |
1.105- |
0.011 |
1.6 |
1.134- |
0.0 |
|
|
|
|
|
|
|
|
|
(104) |
(278) |
(382) |
52 |
2.179 |
27 |
2.334 |
08 |
|||||||||||
Male |
19.4 |
80.6 |
100.0 |
1 |
|
|
1 |
|
|
|
|
|
|
|
|
|
|
|
(74) |
(307) |
(381) |
||||||||||||||||
Child's |
|
|
|
|
|
|
|
|
|
|
|
|
|
|
|
|
|
|
41-45 |
30.2 |
69.8 |
100.0 |
3.4 |
1.887- |
0.000 |
3.58 |
1.921- |
0.0 |
19.4 |
80.6 |
100.0 |
1.4 |
0.935- |
0.1 |
1.1 |
0.719- |
0.5 |
|
(80) |
(185) |
(265) |
31 |
6.236 |
|
|
6.670 |
00 |
(56) |
(232) |
(288) |
12 |
2.132 |
01 |
39 |
1.804 |
80 |
46-50 |
22.8 |
77.2 |
100.0 |
2.3 |
1.299- |
0.005 |
2.5 |
1.361- |
0.0 |
14.6 |
85.4 |
100.0 |
1 |
|
|
1 |
|
|
|
(83) |
(281) |
(364) |
43 |
4.228 |
|
14 |
4.644 |
03 |
(53) |
(310) |
(363) |
|
|
|
|
|
|
|
|
|
|
|
|
|
|
|
|
|
|
|
|
|
|
|
|
|
51-53 |
11.2 |
88.8 |
100.0 |
1 |
|
|
1 |
|
|
29.9 |
74.1 |
100.0 |
2.0 |
1.223 |
0.0 |
1.7 |
0.957- |
0.0 |
|
(15) |
(119) |
(134) |
|
|
|
|
|
|
(29) |
(83) |
(112) |
44 |
3.415 |
06 |
22 |
3.100 |
70 |
Age of the |
|
|
|
|
|
|
|
|
|
|
|
|
|
|
|
|
|
|
18-25 |
|
|
|
|
|
|
|
|
|
11.3 |
88.7 |
100.0 |
1 |
|
|
1 |
|
|
|
|
|
|
|
|
|
|
|
|
(12) |
(94) |
(106) |
|
|
|
|
|
|
26-35 |
|
|
|
|
|
|
|
|
|
21.9 |
78.1 |
100.0 |
2.1 |
1.151- |
0.0 |
1.6 |
0.766- |
0.1 |
|
|
|
|
|
|
|
|
|
|
(92) |
(329) |
(421) |
90 |
4.170 |
17 |
84 |
3.704 |
95 |
|
|
|
|
|
|
|
|
|
|
|
|
|
|
|
|
|
|
|
36 and |
|
|
|
|
|
|
|
|
|
14.4 |
85.6 |
100. |
1.3 |
0.653 |
0.4 |
1.8 |
0.695- |
0.2 |
above |
|
|
|
|
|
|
|
|
|
(34) |
(202) |
0(236) |
18 |
2.661 |
40 |
84 |
5.107 |
13 |
Marital status |
|
|
|
|
|
|
|
|
|
|
|
|
|
|
|
|
|
|
Married and |
|
|
|
|
|
|
|
|
|
20.3 |
79.7 |
100.0 |
2.1 |
1.256- |
0.0 |
2.3 |
1.060- |
0.0 |
cohabitation |
|
|
|
|
|
|
|
|
|
(118) |
(463) |
(581) |
06 |
3.532 |
05 |
87 |
5.372 |
36 |
Single/ |
|
|
|
|
|
|
|
|
|
10.8 |
89.2 |
100.0 |
1 |
|
|
1 |
|
|
|
|
|
|
|
|
|
|
|
|
|
|
|
|
|
|
|
|
|
Others |
|
|
|
|
|
|
|
|
|
16.7 |
83.3 |
100.0 |
1.6 |
0.183- |
0.6 |
1.7 |
0.140- |
0.6 |
|
|
|
|
|
|
|
|
|
|
(1) |
(5) |
(6) |
53 |
14.903 |
54 |
45 |
21.733 |
65 |
Mother's |
|
|
|
|
|
|
|
|
|
|
|
|
|
|
|
|
|
|
Illiterate |
11. |
88.7 |
100.0 |
1 |
|
|
1 |
|
|
7.2 |
92.8 |
100.0 |
1 |
|
|
1 |
|
|
Primary level |
18.0 |
82.0 |
100.0 |
1.7 |
0.707- |
0.233 |
1.4 |
0.559- |
0.4 |
11.2 |
88.8 |
100.0 |
1.6 |
0.620- |
0.3 |
1.3 |
0.481- |
0.5 |
|
(71) |
(324) |
(395) |
17 |
4.170 |
|
22 |
3.618 |
59 |
(51) |
(405) |
(456) |
12 |
4.191 |
28 |
33 |
3.697 |
80 |
Secondary |
|
|
|
|
|
|
|
|
|
|
|
|
|
|
|
|
|
|
|
32.1 |
67.9 |
100.0 |
3.6 |
1.530- |
0.004 |
2.4 |
0.952- |
0.0 |
34.5 |
65.5 |
100.0 |
6.7 |
2.606- |
0.0 |
2.3 |
0.813- |
0.1 |
above |
(101) |
(214) |
(315) |
97 |
8.931 |
|
73 |
6.422 |
63 |
(82) |
(156) |
(238) |
28 |
17.372 |
00 |
89 |
7.014 |
13 |
Place of the residence of the mother |
||||||||||||||||||
Rural |
17.5 |
82.5 |
100.0 |
1 |
|
|
1 |
|
|
12.9 |
87.1 |
100.0 |
1 |
|
|
1 |
|
|
|
(54) |
(255) |
(309) |
|
|
|
|
|
|
(39) |
(264) |
(303) |
|
|
|
|
|
|
Urban |
27.3 |
72.7 |
100.0 |
1.7 |
1.239- |
0.002 |
1.4 |
0.885- |
0.1 |
21.5 |
78.5 |
100.0 |
1.8 |
1.241- |
0.0 |
0.5 |
0.293- |
0.0 |
|
(124) |
(330) |
(454) |
74 |
2.541 |
|
15 |
2.262 |
47 |
(99) |
(361) |
(460) |
56 |
2.778 |
03 |
66 |
1.093 |
90 |
Mother's age |
|
|
|
|
|
|
|
|
|
|
|
|
|
|
|
|
|
|
15-25 |
|
|
|
|
|
|
|
|
|
16.3 (100) |
83.7 |
100.0 |
1 |
|
|
1 |
|
|
26-35 |
|
|
|
|
|
|
|
|
|
26.6 (37) |
73.4 |
100.0 |
1.8 |
1.209- |
0.0 |
1.3 |
|
0.5 |
36 and above |
|
|
|
|
|
|
|
|
|
33.3 (1) |
66.7 |
100.0 |
2.5 |
0.231- |
0.4 |
- |
|
0.9 |
Mother's age |
|
|
|
|
|
|
|
|
|
|
|
|
|
|
|
|
|
|
15-25 |
|
|
|
|
|
|
|
|
|
16.5 |
83.5 |
100.0 |
1 |
|
|
1 |
|
|
26-35 |
|
|
|
|
|
|
|
|
|
23.9 |
76.1 |
100.0 |
1.5 |
1.053- |
0.0 |
0.6 |
0.267- |
0.4 |
36 and above |
|
|
|
|
|
|
|
|
|
0.0(0) |
100. |
100. |
0.0 |
0.000- |
0.9 |
0.0 |
0.000- |
0.9 |
Mother's age current baby |
||||||||||||||||||
15-25 |
|
|
|
|
|
|
|
|
|
19.3 |
80.7 |
100.0 |
2.9 |
1.338- |
0.0 |
2.3 |
0.816- |
0.1 |
26-35 |
|
|
|
|
|
|
|
|
|
20.1 |
79.9 |
100.0 |
3.0 |
1.439- |
0.0 |
1.8 |
0.741- |
0.1 |
36 and above |
|
|
|
|
|
|
|
|
|
7.5(8) |
92.5 |
100.0 |
1 |
|
|
1 |
|
|
Gender of the Head of household |
||||||||||||||||||
Female |
12.7 |
87.3 |
100.0 |
1 |
|
|
1 |
|
|
13.6 |
86.4 |
100.0 |
1 |
|
|
1 |
|
|
Male |
26.1 |
73.9 |
100.0 |
2.4 |
1.46 |
0.0 |
2.6 |
1.534 |
0.0 |
19.8 |
80.2 |
100.0 |
1.5 |
1.006- |
0.0 |
0.7 |
0.378- |
0.3 |
Occupation of the mother |
||||||||||||||||||
Farming/ |
|
|
|
|
|
|
|
|
|
11.5 |
88.5 |
100. |
1 |
|
|
1 |
|
|
Self employed |
|
|
|
|
|
|
|
|
|
20.5 |
79.5 |
100.0 |
1.9 |
1.267- |
0.0 |
1.5 |
0.764- |
0.2 |
Salaried employed |
|
|
|
|
|
|
|
|
|
56.0 |
44.0 |
100.0 |
9.7 |
4.167- |
0.0 |
2.3 |
0.820- |
0.1 |
Unemployed |
|
|
|
|
|
|
|
|
|
26.3 |
73.7 |
100.0 |
2.7 |
1.628- |
0.0 |
1.9 |
0.953- |
0.0 |
Husband's |
|
|
|
|
|
|
|
|
|
|
|
|
|
|
|
|
|
|
Illiterate |
6.3 |
93.8 |
100. |
1 |
|
|
1 |
|
|
5.4(5) |
94.6 |
100.0 |
1 |
|
|
1 |
|
|
Primary level |
20.7 |
79.3 |
100.0 |
|
1.531- |
0.0 |
3. |
1.411 |
0.0 |
12.2 |
87.8 (419) |
100.0 |
2.4 |
0.939- |
0.0 |
2.0 |
0.780- |
0.1 |
Secondary level |
30.5 |
69.5 |
100.0 |
6.5 |
2.586- |
0.0 00 |
4.1 |
1.554- |
0.0 |
38.7 |
61.3 |
100.0 |
10.9 |
4.256- |
0.0 |
3.9 |
1.379- |
0.0 |
Occupation of the father |
||||||||||||||||||
Farming/ agriculture |
17.5 |
82.5 |
100.0 |
1 |
|
|
1 |
|
|
9.3 |
90.7 |
100.0 |
1 |
|
|
1 |
|
|
Self employed |
22.4 |
77.6 |
100. |
1.3 |
0.857- |
0.1 91 |
0.7 |
0.437 -1.454 |
0.4 |
17.2 |
82.8 |
100.0 |
2.0 |
1.208- |
0.0 |
1.35 |
0.614- |
0.4 |
Salaried employed |
39.8 |
60.2 |
100. |
3.1 |
1.753- |
0.0 |
1.5 |
0.766- |
0.2 |
51.6 |
48.4 |
100. |
10.3 |
5.842- |
0.0 |
3.5 |
1.487- |
0.0 |
Unemployed |
21.6 |
78.4 |
100.0 |
1.2 |
0.700- |
0.4 |
1.1 |
0.528 |
0.7 |
15.1 |
84.9 |
100.0 |
1.7 |
0.911- |
0.0 |
1.9 |
0.797- |
0.1 |
Wealth index |
|
|
|
|
|
|
|
|
|
|
|
|
|
|
|
|
|
|
Category 1 |
|
|
|
|
|
|
|
|
|
7.9(7) |
92.1 |
100. |
1 |
|
|
1 |
|
|
Category 2 |
|
|
|
|
|
|
|
|
|
17.4 |
82.6 |
100.0 |
2.4 |
1.091- |
0.0 |
1.6 |
0.739- |
0.2 |
Category 3 |
|
|
|
|
|
|
|
|
|
22.5 |
77.5 (210) |
100.0 |
3.4 |
1.495- |
0.0 |
1.8 |
0.739- |
0.1 |
Characteristics |
Intervention group (n=763) |
Control group (n=763) |
Total (n=1526) |
|
|
|
%(n) |
%(n) |
%(n) |
χ2 |
p value |
Piped, bottled, and public tap/standpipe as main of drinking water |
|||||
Yes |
81.65(623) |
61.73(471) |
71.69(1094) |
74.601 |
< 0 .001 |
No |
18.35(140) |
38.27(292) |
28.31(432) |
|
|
Time to get water from the source less than 30 minutes |
|||||
Yes |
89.65 (684) |
77.85 (594) |
83.75 (1278) |
38.999 |
< 0.001 |
No |
10.35 (79) |
22.15 (169) |
16.25 (248) |
|
|
Making water safe to drink by boiling water, using chemical products , Jibu , filter , water in bottles |
|||||
Yes |
61.47 (469) |
50.46 (385) |
55.96 (854) |
18.762 |
< 0 .001 |
No |
38.53 (294) |
49.54 (378) |
44.04 (672) |
|
|
Storage of drinking water |
|||||
Yes |
62.25 (475) |
58.98 (450) |
60.62 (925) |
1.715 |
0.191 |
No |
37.75 (288) |
41.02 (313) |
39.38 (601) |
|
|
Hand washing station within 5 meters from the toilet |
|||||
Yes |
38.01 (290) |
53.34 (407) |
45.67 (697) |
36.152 |
< 0 .001 |
No |
61.99 (473) |
46.66 (356) |
54.33 (829) |
|
|
Hand washing station with Spigot or bucket with spigot |
|||||
Yes |
55.17 (160) |
45.70 (186) |
49.64 (346) |
6.077 |
0.013 |
No |
44.83 (130) |
54.30 (221) |
50.36 (351) |
|
|
Soap available at the place of handwashing near the toilet |
|
|
|
||
Yes |
35.26 (269) |
33.81 (258) |
34.53 (527) |
0.351 |
0.554 |
No |
64.74 (494) |
66.19 (505) |
65.47 (999) |
|
|
Washing hands at 5 critical moments |
|||||
Yes |
8.00 (61) |
10.48 (80) |
9.24 (141) |
2.821 |
0.093 |
No |
92.00 (702) |
89.52 (683) |
90.76 (1385) |
|
|
Disposal facility near the house |
|||||
Yes |
82.70 (631) |
77.33 (590) |
80.01 (1221) |
6.888 |
0.008 |
No |
17.30 (132) |
22.67 (173) |
19.99 (305) |
|
|
Use of Flush toilet or pit latrine as toilet |
|||||
Yes |
98.03 (748) |
97.90 (747) |
97.97 (1495) |
0.033 |
0.856 |
No |
1.97 (15) |
2.10 (16) |
2.03 (31) |
|
|
Distribution of Vit A |
|||||
Yes |
98.43 (751) |
99.48 (759) |
98.95 (1510) |
4.042 |
0.044 |
No |
1.57 (12) |
0.52 (4) |
1.05 (16) |
|
|
Drug for intestinal worms |
|||||
Yes |
97.77 (746) |
99.08 (756) |
98.43(1502) |
4.233 |
0.039 |
No |
2.23 (17) |
0.92 (7) |
1.57 (24) |
|
|
Distribution of micronutrients |
|||||
Yes |
89.65 (684) |
83.62 (638) |
86.63 (1322) |
11.973 |
< 0 .001 |
No |
10.35 (79) |
16.38 (125) |
13.37 (204) |
|
|
Supplementation preventive zinc |
|||||
Yes |
62.52 (477) |
35.52 (271) |
49.02 (748) |
111.278 |
< 0 .001 |
No |
37.48 (286) |
64.48 (492) |
50.98 (778) |
|
|
Iron distribution |
|
|
|
|
|
Yes |
63.96 (488) |
27.92 (213) |
45.94 (701) |
199.548 |
< 0.001 |
No |
36.04 (275) |
72.08 (550) |
54.06 (825) |
|
|
Malaria prevention |
|||||
Yes |
43.38 (331) |
20.31 (155) |
31.85 (486) |
93.521 |
< 0 .001 |
No |
56.62 (432) |
79.69 (608) |
68.15 (1040) |
|
|
Vaccination |
|
|
|
|
|
Yes |
98.43 (751) |
98.82 (754) |
98.62 (1505) |
0.434 |
0.509 |
No |
1.57 (12) |
1.18 (9) |
1.38 (21) |
|
|
Diarrhea |
|
|
|
|
|
Yes |
63.70 (486) |
65.53 (500) |
64.61 (986) |
0.562 |
0.453 |
No |
36.30 (277) |
34.47 (263) |
35.39 (540) |
|
|
Continuing breastfeeding if diarrhea |
|||||
Yes |
94.65 (460) |
93.20 (466) |
93.91 (926) |
0.906 |
0.341 |
No |
5.35 (26) |
6.80 (34) |
6.09 (60) |
|
|
Nutritional counselling available |
|||||
Yes |
93.18 (711) |
72.48 (553) |
82.83 (1264) |
115.032 |
< 0.001 |
No |
6.82 (52) |
27.52 (210) |
17.17 (262) |
|
|
Kitchen garden available |
|
|
|
|
|
Yes |
38.01 (290) |
45.09 (344) |
41.55 (634) |
7.868 |
0.005 |
No |
61.99 (473) |
54.91 (419) |
58.45 (892) |
|
|