Open Access
Research Article
Max Screen
ISSN: 2393-9060
Copyright: © 2023 Habineza Marc. This is an open-access article distributed under the terms of the Creative Commons Attribution License, which permits unrestricted use, distribution, and reproduction in any medium, provided the original author and source are credited.
Related article at Pubmed, Google Scholar
Childhood stunting is one of the most significant obstacles to human development and the path to prevention is virtually identical. An integration of nutrition‐specific and nutrition‐sensitive intervention was implemented by a program named Gikuriro in five districts of Rwanda to improve maternal and child nutrition. The package included nutrition education and counselling, promotion of agricultural productivity, economic empowerment activities, and provision of Water, Hygiene and Sanitation services. A post-intervention quasi-experimental research with mother-child pairs participating in the program evaluated knowledge and practice towards IYCF as well as uptake of nutrition intervention. Chi- square test was used for comparing knowledge, practice and uptake of nutrition intervention package between intervention group (Nyarugenge and Nyabihu Districts) and control group (Gasabo and Ngororero Districts). A multivariate logistic regression model was used to identify the association between socio demographic characteristics of the mothers and appropriate practice of the mothers towards IYCF as well as Minimum Acceptable Diet. Appropriate practice towards IYCF was significantly higher in intervention group (53.87% vs 48.62%, p value = 0.041) than in control group. The number of children under 5 years in the households was associated with appropriate practice towards IYCF in both intervention and control group. In intervention group, wealth index of the households and age of the mothers when they got their current children were associated with appropriate practice on IYCF whereas in control group, appropriate practice was associated with age of the mothers, comprehensive knowledge of the mothers towards IYCF, occupation of the fathers and occupation of the mothers. Achieving Minimum Acceptable Diet towards IYCF was significantly higher in intervention group (23.33% vs 18.09%, p value = 0.011) than in control group. Education of the fathers was associated with MAD in both intervention and control group. In intervention group, sex and age of the children and sex of the head of household were associated with MAD whereas in the control group marital status of the mothers and occupation of the fathers were associated with MAD.
Keywords: Knowledge, appropriate practice, IYCF, MAD, nutrition intervention package
Childhood stunting is one of the most significant obstacles to human development. Approximately 156 million of the world’s children under the age of 5 years are stunted, with an estimated 80% of these children concentrated in only 14 countries [1]. According to Lancet series 2013, several nutrition specific and nutrition sensitive interventions have been selected to address the problem of stunting [2, 3]. Adapted from Lancet series, Gikuriro program has implemented an intervention package to improve the nutritional status of women of reproductive age and children under five years of age, especially in the first 1,000 days of life. Gikuriro program (“Integrated Nutrition and WASH Activity”) was a 5-year (2016–2020) USAID-funded Integrated Nutrition and WASH Activity (INWA), and the key areas of intervention of this program were Nutrition, Water- Hygiene and Sanitation activities, capacity strengthening, and Behavior Change Communication (BCC). A midterm and end assessment of the activities and outcomes of Gikuriro program have been conducted and the main results of this assessment (comparatively to the baseline survey conducted before the intervention) were available in those documents [4, 5].
The findings of end line evaluation of Gikuriro program showed that the level of update of implemented nutrition intervention comparatively to the base line and mid-term evaluation has improved considerably for all the aspects (socioeconomic status of households, food security, nutritional status among children and mothers, WASH Indicators and Health Care Practice). Nevertheless, even though progressing well, the level of uptake of implemented nutrition intervention package, on the nutritional status for under 5 years children in Gikuriro program was not documented. In addition, the level of knowledge and practice of the mothers towards IYCF following Gikuriro’s nutrition intervention package needs also to be assessed even though Gikuriro‘s evaluation presented some results
Following nutrition intervention package, many studies have revealed an increase of the level of knowledge, practice and uptake of nutrition intervention but the package of nutrition intervention was very limited. For example, caregiver knowledge and IYCF practice improved by 0.2 SD, as did food expenditures on recommended foods and dietary diversity following an innovative behavioral change strategy in Bolivia [6]. Other studies revealed that nutrition education improved the complementary feeding knowledge and practice of caregivers [7, 8, 9]. The specific objectives of this study were to evaluate the level of knowledge of the mothers of children after birth until 24 months on IYCF, to assess the appropriate practice of mothers towards IYCF, to assess the Minimum Acceptable Diet and the level of uptake of integrated nutrition intervention package following the nutrition intervention implemented by Gikuriro program.
The study was conducted in Rwanda and falls within a USAID funded Integrated Nutrition and Water, Sanitation, and Hygiene (WASH) Activity (INWA) which has been renamed in Kinyarwanda Gikuriro Program. It covered five Districts including Kayonza , Ngoma (Eastern Province), Nyabihu District ( Western Province) , Nyarugenge and Kicukiro ( City of Kigali). As it is displayed in Figure 1, the intervention group came from Nyarugenge District (urban area) and Nyabihu District (rural area), two out of the 5 Districts where intervention package has been implemented and the control group came from Gasabo District (urban area) and Ngororero District (rural area).
It was a quasi-experimental study including two groups: an intervention group and a control group. The intervention group was made up of all the children born from January 1st to December 31st 2018 in Gikuriro implementation program as well as their mothers in the Districts of Nyarugenge and Nyabihu selected purposively as urban (Nyarugenge) and rural (Nyabihu) Districts. The intervention group benefited from the program at least for 2 years and towards the end of the intervention in September 2020.The study population came from 41- 53 months aged children and their mothers of Nyarugenge and Nyabihu Districts. Data information were collected from the mothers aiming at knowing retrospectively their knowledge and practice towards IYCF when their children had between 0 and 24 months.
For the level of uptake of nutrition intervention package, data collected concerned the end of Gikuriro program in 2020. This intervention group has been exposed to all evidence based nutrition specific and nutrition sensitive intervention package of services through community and health facility platforms
The comparison group was made up of all the children born at the same time as for the intervention group as well as their mothers in the District of Gasabo (urban District) and Ngororero (rural District).This group has not been exposed to Gikuriro program. Note that Nyabihu District and Ngororero District have many similarities: the 2 Districts had almost the same prevalence stunting rate in 2015 (59% for Nyabihu and 56% for Ngororero) (10),the stunting prevalence rate for the 2 Districts was above the WHO critical threshold (> 40 percent) in 2015 (11), the 2 Districts have almost similar geographic and socio-economic status(12,13),the overall employment and the economic inactivity rates of the resident population aged 16 years and above are almost similar (13, 14 ).
Likewise, Nyarugenge as urban intervention District and Gasabo as urban comparison District have also many similarities: ranked among the Districts with the lowest stunting prevalence rates in Rwanda in 2015 (15), almost similar geographic and socio-economic status (16), the overall employment, unemployment and economic inactivity rates of the resident population aged 16 years and above are almost similar (16,17).In the 2 District, household income is driven by wage income followed by business income (16,17)
Malnutrition and food security have been highlighted in the Economic Development and Poverty Reduction Strategy II as foundational issues that need coordinated, strengthened, and scaled-up community-based nutrition programs and information campaigns across the country of Rwanda. To address this issue, there was a need to support the implementation of existing district plans to eliminate malnutrition and to undertake communication campaigns to diversify household food production and consumption. It is against the above background and in partnership with the Rwandan Government that the United States Agency for International Development in Rwanda (USAID/Rwanda) supported a consortium of two International Agencies—Catholic Relief Services (CRS) and SNV, the Netherlands Development Organization—to implement the Integrated Nutrition and WASH Activity (INWA) called Gikuriro through decentralized Government of Rwanda systems and structures, and local civil society organizations in eight target districts namely Kayonza, Kicukiro, Ngoma, Nyabihu, Nyanza, Nyarugenge, Ruhango, and Rwamagana. Gikuriro (meaning “good growth” as opposed to stunting in Kinyarwanda) was a 5 year ( 2015-2020) developed to combat food insecurity among pregnant women of reproductive age and children under five years , particularly during the critical first 1,000 days of life . A total of 200,000 children under the age of 2 years and 160,000 women were estimated to benefit from the Gikuriro program.
The program has covered all the targeted beneficiaries with Nutrition, WASH, Capacity building and Behavior change interventions, and all this came in the framework of Gikuriro program endeavors to address goals number 2 and 6 at once of the Sustainable Development Goals (SDGs). Goal number 2 forecasts zero hunger while number 6 advocates for clean water and sanitation for all by the year 2030.
Gikuriro conceptual framework on evidence-based nutrition interventions was adapted from the Lancet Series 2013 and nutrition interventions were divided in nutrition specific and nutrition sensitive interventions. Nutrition specific interventions and programmes are interventions or programmes that address the immediate determinants of fetal and child nutrition and development. Nutrition sensitive interventions and programmes are interventions or programmes that address the underlying determinants of fetal and child nutrition and development (2, 3).
Gikuriro nutrition specific intervention package was focused on the following:
• During pregnancy :
✓ Nutrition counselling in the Village Nutrition Schools: pregnant women received nutrition education and counselling by Community Health Workers (CHWs) and nutritionists previously trained on the module of counselling guide from the program implementers. The trained nutritionists counselled the pregnant women during regular antenatal care visits and at the household level. Among the contents of the educational and counseling guide were (1) to eat one extra small meal or “snack” (extra food between meals) each day to provide energy and nutrition for the mother and her growing baby; (2) to eat the best nutritious foods available, including milk, fresh fruit and vegetables, meat (including organ meat like liver, heart and kidney), fish, eggs, grains, groundnuts, peas and beans; (3) to take iron and folic acid tablets to prevent anemia during pregnancy; (4) to use iodized salt (5) to attend antenatal care at least 4 times during pregnancy, (6) to take de-worming tablets to help prevent anemia; (7) to prevent malaria by sleeping under an insecticide-treated mosquito net every night.
✓ In addition were provided: Folic acid supplementation, Multiple micronutrient supplementation, Calcium supplementation, Balanced energy protein, supplementation Iron, Promotion of iodized salt, ANC (at least 4 visits), HIV testing, Malaria prevention, Maternal deworming.
• During delivery/post-natal period: Delayed cord clamping, Early initiation of breast feeding ,Vitamin K administration, Neonatal vitamin A supplementation, Kangaroo mother care Postnatal care.
• During infant/children period :
Oliver Wendell Holmes (1809-1894 AD)
✓ Exclusive breast feeding and Complementary feeding : Mothers were educated in Village Nutrition Schools about when they should exclusively breastfeed, the types of foods they should supply to their children, when they should shift to introducing complementary foods, they learn cooking practice, preparation of balanced diet, best feeding practice, and preparation of kitchen garden. To improve dietary diversity and quality of diet, the Gikuriro program distributed small livestock, poultry, orange-fleshed sweet potato vines, iron-rich bean seeds and seedlings for fruit trees to enable the mothers to prepare a balanced diet for their children and encouraged the intake of animal protein foods (e.g., milk and eggs), fortified foods, vitamin and mineral-rich foods.
✓ Child-growth monitoring (measuring the child’s weight, height, and upper-arm circumference) was done in Village Nutrition Schools to determine if the child is at risk of malnutrition and to take action accordingly
✓ Management of SAM, Management of MAM: training for mothers with malnourished children coupled with providing these children with a balanced diet after obtaining their baseline anthropometric measurements, mobilizing men to participate in their children’s nutrition.
✓ In addition : Vitamin A supplementation , Preventive zinc supplementation, Multiple micronutrient supplementations (Ongera), Iron supplementation ,Therapeutic zinc for diarrhea Malaria prevention , deworming in children, Immunization.
✓ Gikuriro nutrition sensitive intervention package was focused on the following:
• Promotion of increased agricultural productivity: this involved promotion of agricultural productivity through implementation of Bio Intensive Agriculture Techniques (BIATs), Farmer Field Learning School (FFLS), promotion of bio fortified crops and small livestock in all Villages. The main activities included training on crop disease/pest control and improving the soil fertility, supplying and promoting indigenous vegetables and bio-fortified crops (orange fleshed sweet potato, iron rich beans, quality protein maize and orange maize), promoting agriculture activities in urban areas using bags in case of no land, provision of small livestock (chicken, rabbit, goats and pigs) and sensitization on consumption of home garden produced through meetings and monitoring field visits.
• Social protection interventions (economic strengthening): The Gikuriro program enhanced and promoted Saving and Internal Lending Communities (SILC) Groups approach as a way of responding to household financial problems that prevent them from attaining better nutrition outcomes. This was a holistic community based, user-owned and self-managed savings method that offers a conducive environment for poor households to save and borrow to increase their income. Moreover, the main purpose was to teach them the basic financial management skills to better manage their existing resources. The main activities of SILC under Gikuriro were as follows: first, training of trainers was conducted to Gikuriro sub-partners (the in charge of economic strengthening and project coordinators) and district staff cooperatives. Then the trained staff trains the sector cooperative officers where they would identify community volunteer called field agents. They are identified within the community using a checklist, after which they are interviewed by CRS. They are trained to form and manage SILC groups which will ensure that all beneficiaries are embraced in the SILC groups and receive high quality financial services. Then the field agents sensitized the people about SILC and form groups. Members select each other based on characteristics of trustworthiness, honesty, reliability, and punctuality. One field agent supervises 10 groups of which one group consists of 25 to 30 members. Then after a group is formed, they decide how often to meet, the minimum contribution amount and how long to function and discuss about internal rules and select management committee. The group also selects Chairperson, Secretary, Treasurer and a Money Counter from its members. The frequency of meetings and contributions is on weekly basis. The maximum contribution does not exceed five times the minimum contribution. The cycle of savings and lending is 12 months. Pooled contributions create a loan fund for members to be repaid with interest and a social fund to help members with emergency situations. By the end of the cycle, all loans are repaid. Accumulated savings and interest earnings are paid out in proportion to members’ contributions relative to the amount that has been invested by each member throughout the cycle. After pay-out, the group may disband or decide to continue for another cycle and may invite new members to join. During the year, more focus is put on monitoring of established SILC groups to ensure savings are bringing a change in the nutritional outcomes at target HHs. This enables the poor to build up useful lump sums without incurring excessive debt or interest charges. The goal is to help these households better manage their existing resources by teaching them basic financial management skills.
• Water, Sanitation and Hygiene (WASH) services: This intervention was aimed at improving WASH behavior in the community to avoid nutrition problems resulting from poor WASH behaviors using Community Based Environmental Health Promotion Program (CBEHPP) approach through Community Health Clubs (CHC) at Village level. CBEHPP is a hygiene behavior change approach to reach communities and empower them to identify their personal and domestic hygiene and environmental health-related problems (including access to safe drinking water for instance having boreholes, water kiosks, extending water pipelines to each Village and improved sanitation) and to solve them. CHC and a demonstration site at every Village is formed and initiated. They conduct 20 weekly community health club sessions using high-quality instructional materials. The CHCs are responsible of ensuring that levels of hygiene are monitored, together with the CHW facilitator, who visit each household to observe the household sanitation and environmental conditions. These observations, known as a ‘household inventory’ are conducted on a regular basis. Besides a Chairperson and Secretary are elected, who keep a register of attendance of the members.
• In addition were provided: Parenting education, Bio fortified food, Gender mainstreaming. 10 ) To evaluate the level of knowledge, a questionnaire was used and the Chi -square test with 5% level of significance enabled to compare the intervention group and the control group. The knowledge questionnaire items was related to awareness of the mothers about feeding of young infants 1–6 months; awareness of the mothers about complementary feeding 6-23 months and mothers knowledgeable on the Minimum Acceptable Diet
Was considered as a mother with comprehensive knowledge the one who knew altogether that:
a) breastfeeding starts within one hour after birth, b) the recommended length of exclusive breastfeeding is the first 6 months after birth), c) a mother should continue breastfeeding for 24 months or more, d) the age of starting complementary foods is 6 months after birth; e) the liquid soft should be given to the child at 6 months; f) the semi solid food should be given to the child at 7-8 months, g) the solid food should be given to the child at 9-23 months.
20 ) To assess the practice of the mothers towards IYCF, Chi square test for comparing intervention and control group was used and the practice questionnaire towards IYCF items was related to the percentage of children breastfed within one hour after birth, the percentage of under 6-month- old exclusively breastfed, the percentage of children who continued breastfeeding 24 months and more, the percentage of children who started complementary feeding at 6 months (liquid soft), the percentage of children with appropriate practice towards IYCF, the percentage of children who started semi solid foods at 7-8 months and solid foods from 9 months, the percentage of children who received a balanced Diet ( Minimum Dietary Diversity), the percentage of children who received the meal frequency recommended (Minimum Meal Frequency),the percentage of children with the Minimum Acceptable Diet.
World Health Organization (WHO) and United Nations Children’s Fund (UNICEF) set a global strategy for optimal infant and young child feeding (IYCF). The strategy recommends the initiation of breastfeeding within one hour of birth, exclusively breastfed for the first six months, nutritionally adequate and safe complementary feeding starting from the age of 6 months with continued breastfeeding up to 2 years of age or beyond (18). Based on this recommendation, a mother who altogether initiated breastfeeding within one hour of birth, exclusively breastfed for the first 6 months, started complementary feeding at 6 months and continued breastfeeding up to 2 years of age and beyond, has been considered as having an appropriate practice towards IYCF in this study.
In addition, the percentage of children who received a balanced diet (Minimum Dietary Diversity), the percentage of children who received the meal frequency recommended (Minimum Meal Frequency), the percentage of children with the Minimum Acceptable Diet were calculated.
The percentages of children with Minimum Dietary Diversity , Minimum Meal Frequency and Minimum Acceptable Diet were calculated by asking the mothers to recall what their children had eaten and for how many times in the last 24 h preceding the survey. The Minimum Dietary Diversity (MDD) was defined as the percentage of children 41–53 months of age who consumed foods from at least four out of seven food groups during the previous day. The seven food groups were as follows: (1) grains, roots, and tubers; (2) legumes and nuts; (3) dairy products (milk, yogurt, cheese); (4) flesh foods (meat, fish, poultry, and liver/organ meats); (5) eggs; (6) vitamin A–rich fruits and vegetables; and (7) other fruits and vegetables. The Minimum Meal Frequency (MMF) was defined as the percentage of children 41-53 months of age who consumed three meals or more during the previous day. The Minimum Acceptable diet was defined as the percentage of children 41-53 months of age who received the Minimum Dietary Diversity and the Minimum Meal Frequency during the previous day (19).
30 ) To assess the level of uptake of integrated nutrition intervention package , Chi square test for comparing intervention and control group was used and the level of uptake questionnaire was related to the percentage of households having benefited from different nutrition intervention package at the end of the program such as Vitamin A distribution, drugs for intestinal worms distribution, Iron distribution, micronutrients distribution, malaria prevention, vaccination, supplementation preventive zinc, breastfeeding if diarrhea, nutrition counselling ,kitchen garden, WASH activities.
Even though Gikuriro implemented nutrition intervention package in intervention group only, we recall here that the control group received also some components of the nutrition intervention package through routine activities as it is mentioned in National Food and Nutrition Policy (20).For this reason, we compared the level of uptake of nutrition intervention package between intervention group and control group at the end of the intervention group to highlight a possible difference between the 2 groups.
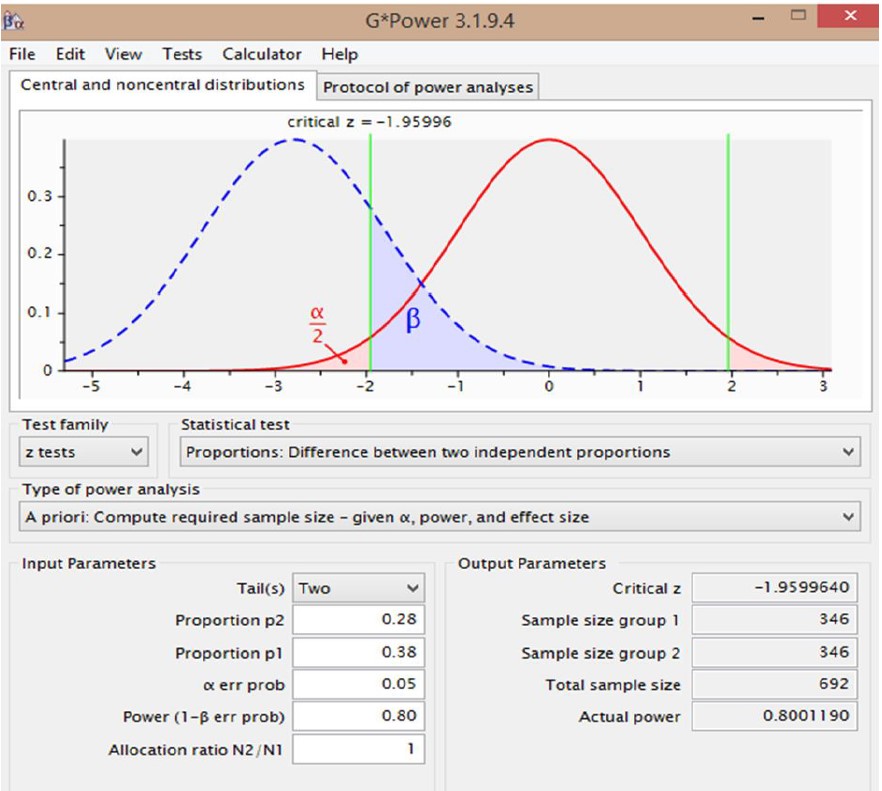
The sample size was calculated using G* Power, software determining the sample size needed for tests of two independent proportions (https://stats.idre.ucla.edu)
p1: Proportion of stunting children under 5 years old in the non- intervention group (p1 = 0.38 according to DHS 2015),
p2: Proportion of stunted children in the intervention group to be 0.28 assuming 10% drop in stunting in intervention group over the four years period of intervention.
G*Power calculated the number of subjects needed to test a difference in proportions of 0 .10 with a power of 0.80 at alpha equal to 0 .05 and an intervention to control ratio of 1:1. As it is shown in Figure 2, this number is 346 for each group (intervention and control). After considering the design effect of 2 and 10% of non-response rate, the sample size was 761 for each group: intervention group: 761, control group: 761.
As indicated in Figure 3, a multi cluster sampling process was used with the first stage involving the 4 intervention and control Districts. They were followed by the selection of Sectors, Cells and Villages using a proportionate probability sampling. At the level of the villages, 381 mother- child pairs were randomly selected in each District among all the children born from January 1st to December 31st, 2018.
Kobo Collect software (v 2022.2.3) was used for data collection. In total, ten enumerators and 2 supervisors have been recruited for data collection from May 9 to May 21st, 2022. Data collectors were trained on the objectives, the relevance of the study, questionnaire contents, confidentiality of the data and informed consent before starting collection. Data collection activities were supervised on a daily basis and data were sent to a central server then transferred to Excel format and SPSS for further analysis. During the period of data collection, a structured questionnaire was used to collect data regarding the knowledge and practice of the mothers towards IYCF and the level of uptake of nutrition intervention package of the households. The questionnaire was translated in Kinyarwanda using forward and backward translation to see if the meaning remained the same. The questionnaire assessed the following variables: child’s sex, child’s age, number of family members who live in the household ,child’s order/rank among live siblings, mother’s age, marital status of the mother, education level of the mother, religion of the mother, place of the residence of the mother, age of the mother when she got married, age of the mother when she had her first baby, age of the mother when she had the current child of interest, number of children the mother has given birth to, number of children still alive today, number of children under the age of five, birth interval between the current child of interest and the previous birth, gender of the head of the household, occupation of the mother, occupation of the husband, household wealth index and comprehensive knowledge of the mothers on IYCF.
The analysis was performed using IBM SPSS Statistics version 25.
Univariate analysis was performed and descriptive statistics using percentage and number of distribution of the mother-child pairs by socio demographic characteristics were computed
This was followed by bivariate analysis where chi- square test was used for comparing knowledge, practice, appropriate practice and level of uptake of nutrition intervention package between intervention and control group based on identified nutrition intervention package. The results were considered statistically significant at p < 0.05. Chi- square test was also used for comparing appropriate practice of the mothers towards IYCF and socio demographic characteristics of the study population in intervention and control group at level of significance less than 0.05.
A multivariate logistic regression model was used to identify the association between the socio demographic characteristics of the mothers as explanatory variables and appropriate practice of the mothers towards IYCF as dependent variable. Variables with a p value < 0.05 in bivariate analysis were entered into multivariate logistic regression. Adjusted Odds ratios and their 95 % confidence intervals were computed and statistical significance was defined as p ≤ 0.05.
In the same way as for appropriate practice of the mothers towards IYCF, MAD has been computed in intervention group and in control group to highlight a possible difference between the 2 groups by using chi square test and statistical significance defined as p ≤ 0.05. Thereafter, associated factors with MAD have also been identified in multivariate logistic regression analysis.
A total of 763 mother- child pairs for intervention group and 763 mother-child pairs for control group were considered in the study. When comparing the basic demographic characteristics of the participants, there was a significant difference between intervention and control groups for the number of family members living in the household (p value = 0.002), mother’s marital status (p value = 0.009), mother's level of education (p value < 0.001), mother's religion (p value< 0.001),gender of the head of the household (p value < 0.001) ,occupation of the mother (p value < 0.001), husband’s level of educational (p value < 0.001),occupation of the father ( p value < 0.001) and the household 's wealth index (p value = 0.033) (Table 1).
Between intervention and control group, there was no significant difference regarding the knowledge of the mothers on initiation of breastfeeding within one hour after birth (97.12% vs 97.51%, p value = 0.634), exclusive breastfeeding up to 6 months after birth (96.59% vs 97.12%, p value = 0.557), continuing breastfeeding for 24 months and more (96.07% vs 96.98%, p value = 0.328), initiation of complementary feeding by 6 months ( 94.49% vs 94.10%, p value = 0.741), and initiation of semi solid food by 7-8 months (41.15% vs 41.55% , p value = 0.876).
Contrariwise, mothers from control group had significantly higher knowledge on initiation of liquid soft food at 6 months ( 57.54% vs 49.54%, p value =0.0017), initiation of solid food from 9 months ( 20.58% vs 7.86% , p value < 0 .001), having 5 and more groups of food in a day (MDD) (8.39% vs 5.50% , p value = 0.027), having 5 and more groups of food and giving food 3 times and more in a day (MAD) ( 7.73% vs 4.85% , p value = 0.021 ) and comprehensive knowledge on IYCF( 10.62 % vs 3.15%, p value < 0.001).
Only in 2 cases, mothers from intervention group had significantly higher knowledge than mothers from control group: giving food 3 times a day and more (MMF) (96.20 % vs 93.32%, p value = 0.012), importance of micronutrients for our bodies (99.74% vs 97.25%, p value < 0.001) (Table 2)
Some components of the maternal practice on IYCF were relevant in the intervention group than in the control group: breastfeeding until 24 months (53.03% vs 37.17%, p value < 0.001), initiation of breastfeeding within one hour after birth (94.46% vs 91.53% , p value = 0.026), exclusive breastfeeding for 6 months (92.21% vs 89.28% ,p value = 0.049).
The appropriate practice of the mothers towards IYCF was appreciable in the intervention group (53.87% vs 48.62%, p value = 0.041) than in control group.
In addition, were also significantly higher in intervention group than in control group: Minimum Dietary Diversity (MDD) (29.36% vs 24.77%, p value = 0.044), Minimum Meal Frequency (MMF) (59.76% vs 52.82%, p value = 0.006) and Minimum Acceptable Diet (MAD) (23.59% vs 18.09 %, p value = 0.008) (Table 3).
a) Bivariate analysis: Appropriate practice and socio demographic characteristics of the study population.
As shown in Table 4, the following variables were significant (p< 0.05):
-In intervention group
Age of the mother, mother’s age when she had the current child, number of children under 5 years in the household, wealth index of the household
-In control group:
Age of the mother, place of the residence of the mother, number of children under 5 years in the household, occupation of the mother, occupation of the father and comprehensive knowledge on IYCF.
a) Factors associated with the appropriate practice on IYCF.
Table 5 displays the final results in multivariate analysis for the intervention group and the control group
-In intervention group:
Mothers aged 26-35 years when they got their current child were almost 2 times more likely to have appropriate practice towards IYCF( AOR =1.549 , CI at 95%[1.041-2.305],p value = 0.031) compared to mothers aged 15-25 years when they got their current child , children from households with 1-2 children under 5 years were 8 times more likely to have appropriate practice on IYCF(AOR = 8.135,CI at 95% [1.808-36.603], p-value = 0.006) compared to children from households with 3-5 children, and children from household with category 3 of wealth index were almost 2 times more likely to have appropriate practice on IYCF(AOR = 1.792 ,CI at 95% [1.026-3.130], p-value = 0.040) compared to children from households with category 1 of wealth index.
- In control group
Children whose mothers were aged 26-35 years were almost 2 times more likely to have appropriate practice on IYCF( AOR = 1.969 , CI at 95% [ 1.227- 3.159],p value = 0.005) compared to children whose mothers were aged 18-25 years , children from households with 1-2 children under 5 years were 6 times more likely to have appropriate practice on IYCF(AOR = 6.329 ,CI at 95% [1.377- 29.089], p value = 0.018) compared to children from households with 3- 5 children, children whose mothers were self-employed were almost 2 times more likely to have appropriate practice (AOR = 1.686, CI at 95% [1.046-2.717], p value = 0.032) compared to children whose mothers were unemployed, children whose fathers were farmers were almost 2 times more likely to have appropriate practice (AOR = 1.841, CI at 95% [1.060-3.197],p value = 0.030 ) compared to children whose fathers were unemployed, children whose mothers had comprehensive knowledge on IYCF were almost 2.5 times more likely to have appropriate practice on IYCF(AOR = 2.374, [1.420-3.968], p value = 0.001) compared to children whose mothers did not have comprehensive knowledge on IYCF.
Thus, the number of children under 5 years in the households was the factor associated with appropriate practice on IYCF in intervention and control groups.
a) Bivariate analysis: Minimum Acceptable Diet and socio demographic characteristics of the study population.
As shown in Table 6, the following variables were significant (p< 0.05):
-In intervention group:
Child’s sex, child’s age, mother’s education, place of the residence, gender of the head of the household, husband’s education, occupation of the father.
-In control group:
Child’s age, mother’s age, marital status of the mother, mother’s education , place of the residence , mother’s age when she got married, mother’s age when she had her first baby, mother’s age when she had her current child , gender of the head of household, mother’s occupation, husband’s education father’s occupation, wealth index.
As shown in Table 8, the following variables were significantly higher in intervention group than in control group: piped, bottled, and public tap/standpipe as main of drinking water ( 81.65% vs 61.73% , p value < 0.001), time to get water from the source less than 30 minutes ( 89.65% vs 77.85% , p value < 0.001), making water safe to drink by boiling water, using chemical products , Jibu , filter ,water in bottles (61.47% vs 50.46%, p value < 0 .001), hand washing station with spigot or bucket with spigot (55.17% vs 45.70% , p value = 0.013), disposal facility near the house (82.70% vs 77.33%, p value = 0.008), distribution of micronutrients (89.65% vs 83.62% ,p value < 0 .001), supplementation preventive zinc (62.52% vs 35.52% , p value < 0 .001), iron distribution (63.96% vs 27.92% , p value < 0.001), malaria prevention (43.38% vs 20.31%, p value < 0 .001), nutritional counselling available (93.18% vs 72.48%, p value < 0.001).
The objective of this study was to assess the level of knowledge and practice of the mothers towards IYCF and to assess the level of uptake of integrated nutrition intervention package in Rwanda. The study compared an intervention group made up of mother- child pairs which has been exposed to nutrition intervention package and a comparison group that has been exposed to some components of the nutrition intervention package through routine activities as it is mentioned in Rwanda National Food and Nutrition Policy. Nutrition intervention package targeting children after birth until two years were divided in Nutrition specific intervention package and nutrition sensitive intervention package as it has been said above
Nutrition specific intervention was focused on the following:
-Early initiation of breastfeeding, Exclusive breastfeeding and Promotion of continued breastfeeding: mothers were educated in Village Nutrition Schools about early, exclusive and continued breastfeeding. Established through the Gikuriro program, Village Nutrition Schools were hosted in villagers’ home where the mothers were gathered together for the education. Run by two volunteer community health workers and a “model mother” (nominated by the community to receive ongoing training and on-the-job mentoring), the village nutrition schools initially run for 12 days before becoming monthly meetups.
-Adequate complementary feeding practice: Again in Village Nutrition Schools, mothers learn how to cook healthy food and lower the risk of malnutrition for their children. Each mother also brings something to contribute to cooking a healthy meal: a variety of cook healthy food using what’s available in their homes.
-Education on micronutrient supplementation, Micronutrients distribution, Distribution of Vitamin A and Vitamin K, deworming tablets distribution: Distribution is carried out at the level of Village Nutrition School.
Nutrition sensitive intervention package was related mainly to:
-Increased agricultural productivity (Kitchen Garden) and Economic strengthening: Introduction of FFLSs (Farmer Field Learning School) so people can acquire learnings related to farming, economic empowerment activities through SILCs (Saving and Internal Lending Communities), with income-generating activities to economically empower health insurance, leading to better access to health services.
- WASH activities: training of community members on WASH behavior changes such as hand washing, waste management, and toilet use, promoting personal and household hygiene by CHWs , support of community-owned initiatives such communities addressing hygiene problems by building latrines, provision of water tanks to vulnerable households, promotion of drinking clean and boiled water using clean containers, improving water access by installation of piped water and increasing water sources, helping the community members in sanitation and hygiene practice through clubs, thereby contributing to the children under five years of age.
When comparing the basic demographic characteristics of the participants between intervention and control groups at the end of integrated nutrition intervention package, there was a significant difference for the number of family members living in the household (p value = 0.002), mother’s marital status (p value = 0.009), mother's level of education (p value < 0.001), mother's religion (p value < 0.001),gender of the head of the household (p value < 0.001) ,occupation of the mother (p value < 0.001), husband’s level of educational (p value < 0.001),occupation of the father ( p value < 0.001) and the household 's wealth index (p value = 0.033). We might assume that the differences are due to the effect of integrated nutrition intervention package but with caution because assessment at the beginning before intervention has not been done. We might also expect as implications to find an association between the aforementioned socio demographic characteristics with appropriate practice of the mothers towards IYCF either in intervention group or in control group.
Overall, this study reported that knowledge of the mothers towards IYCF was good without any significant difference between intervention and control groups for many characteristics.
Nevertheless, increasing in favor of the control group has been observed in some cases and it was only in 2 cases where knowledge was significantly higher in intervention group than in control group. Similar studies have demonstrated an increase in knowledge among the intervention group. It is the case with research on maternal nutrition counseling in Bangladesh (21), child growth intervention program on caregivers' knowledge and practice related to child feeding in Ghana (22), and intervention on child feeding practice and caregiver knowledge recently done in Kenya (23).
The inconsistency of our findings related to knowledge could have been due to the fact that the mothers were asked to answer knowledge questions towards IYCF retrospectively. By using this strategy, people run the risk of forgetting precisely when the knowledge was learned, which would produce unreliable findings.
However, since practice towards IYCF was significantly higher in intervention group than in control group, a direct effect of some nutrition interventions on the practice without necessarily improving the knowledge of the participants could be the explanation if knowledge of the mothers towards IYCF remains considered low in intervention group.
Numerous other studies have noted that maternal practice increased in the intervention group after nutrition intervention compared to the control group, with this study being unique in that we used a nutrition package intervention while in other studies, only a few interventions were used.
The studies listed below are among others studies where maternal practice was higher in the intervention group following nutrition interventions: a comparison of the child feeding practice between intervention group (Essential Health Care plus nutrition counseling) and comparison group (Essential Health Care package) in Bangladesh revealed that nutrition counseling had a positive impact on increasing IYCF practice (21).A nutrition intervention program that includes growth monitoring, nutrition education for caregivers, and the administration of lipid-based nutritional supplements (LNS) was implemented in Uganda. When this intervention group was compared to the comparison group, it was found that the intervention group had more dietary diversity, higher minimum meal frequency, higher minimum acceptable diet, and higher iron- rich complementary items (24).
However, other studies have shown contradictory or inconsistent findings regarding effect of nutrition interventions on maternal practice. For instance, a study done in Vietnam between 2012 and 2017 found that the establishment of community-based IYCF support groups to offer breastfeeding support, complementary feeding support, and IYCF information to community members had little effect on actual practice (significant impact was only seen for handwashing and minimum dietary diversity) (25).
In another study conducted in Kenya, even though post-intervention knowledge of the mothers towards IYCF was improved, there was no effect of the intervention on IYCF indicators (e.g., dietary diversity and meal frequency), demonstrating that those who improve their knowledge of nutrition may occasionally face barriers to access the foods to improve their nutrition . In this study, it was also found that less than 15% of children met the minimum acceptable diet criteria (23).
The findings of this study revealed that appropriate practice towards IYCF was significantly higher in intervention group (53.87% vs 48.62%, p value = 0.041) than in control group. This demonstrates that integrated nutrition- specific and nutrition- sensitive intervention package implemented in intervention group played an important role in increasing practice of the mothers towards IYCF.
In both intervention and control group, the appropriate practice in this study (53.87% vs 48.62%) was higher than the results of studies carried out in different areas of Ethiopia where the appropriate practice on IYCF was between 7% and 32.1% (26, 27, 28, 29, 30). However, the findings were lower than findings in Nepal where appropriate practice towards IYCF was 56.81% (31) and in one study carried out in Ethiopia where appropriate practice towards IYCF was 65.8% (32).
In those studies, appropriate practice towards IYCF was measured and adapted from WHO indicators explained above (33, 30).
In intervention group, appropriate practice was found to be associated with wealth index, number of children under five years in the households and age of the mothers when they had their current children.
In control group, appropriate practice was found to be associated with the number of children under five years in the households, comprehensive knowledge of the mothers on IYCF, age of the mothers, occupation of the fathers and occupation of the mothers.
Thus, in this study, appropriate practice in both intervention and control group was found to be associated with the number of children under five years in the households.
Children in the intervention group who came from households with a wealth index category 3 were more likely to have appropriate practice towards IYCF than children from households with a wealth index category 1. These expected findings are similar to previous studies such as studies conducted in Timor-Leste and Ethiopia (34, 35). This can be explained by the fact that households with category 3 may help to achieve appropriate practice towards IYCF since they are in a better socioeconomic position to attain food security, which may impact their appropriate practice towards IYCF.
Children in control group, born to mothers with comprehensive knowledge on IYCF had higher odds of appropriate practice towards IYCF compared to children born to mothers without comprehensive knowledge. This is consistent with a previous study carried out in Northwest Ethiopia where appropriate practice towards IYCF was higher among mothers with high IYCF knowledge compared to mothers with poor IYCF knowledge (36). Maternal knowledge is therefore crucial in meeting the requirements for appropriate practice towards IYCF. Likewise, mothers aged 26-35 years were more likely to have appropriate practice towards IYCF than mothers aged 18-25 years. This means that younger mothers do not practice appropriate IYCF compared to older mothers. Similarity has been found in a study carried out in Malawi where children whose mothers were older than 24 years were more likely to achieve minimum dietary diversity (37). This may be due to the fact that older mothers are experienced and have knowledge on how to raise their children as compared to younger women. It also has been found that children whose mothers were self- employed were more likely to have appropriate practice compared to children whose mothers were unemployed and children whose fathers were farmers were more likely to have appropriate practice compared to children whose fathers were unemployed. This may be related to the fact that farmers and self-employed people earn more money than unemployed people, allowing them to feed their children. Other studies carried out in Ethiopia reported that factors found to influence appropriate practice on IYCF are maternal and paternal occupations (38, 32).
Children in both intervention and control groups from households with fewer children under the age of five (1-2) had satisfactory appropriate practice toward IYCF than children from households with more children under the age of five (3-5).This is in line with a prior study conducted in the Oromia area of Ethiopia, where inappropriate practice towards IYCF was 5.4 times higher among women with 3-4 children (even though not under 5 years) compared to women with 1-2 children (30). This can be explained by the fact that as homes have more children under the age of five, it becomes more difficult to feed them properly since they frequently have to share the limited food that is available to them.
The findings of this study revealed that achieving Minimum Acceptable Diet was significantly higher in intervention group (23.33% vs 18.09%, p value = 0.011) than in control group. This result could be explained by the high level of appropriate practice following the nutrition intervention in intervention group. The WHO also states that the Minimum Acceptable Diet is the most significant indicator for assessing IYCF practice (39).In another study carried out in Bangladesh, comparable results have been found: 31.2% received Minimum Acceptable Diet in intervention group versus 25.3% in control group with a p value equal to 0.017 (40).
In intervention group, Minimum Acceptable Diet was found to be associated with sex of the children, age of the children, sex of the head of households and education of the fathers.
In control group, Minimum Acceptable Diet was found to be associated with marital status of the mother, education of the fathers, and occupation of the fathers
Thus, in this study, Minimum Acceptable Diet in both intervention and control group was found to be associated with the education of the fathers.
In intervention group, male children were less likely to achieve Minimum Acceptable Diet than female children contrary to studies conducted in Ethiopia where male children were more likely to attain Minimum Acceptable Diet than female children (41, 42) .This suggests that in order for male children to receive the necessary intake of food, more care should be given to their nutrition. In addition, compared to children aged 51–53 months, children aged 41–45 months and 46–50 months were more likely to achieve MAD. These results are consistent with research from Madagascar, where it was discovered that older, no longer breastfed children were less likely to achieve Minimum Acceptable Diet. In fact, in those studies, children between the ages of 24 and 59 months were less likely to achieve Minimum Acceptable Diet than younger children (43, 44). These findings imply that nutrition programs may need to concentrate on children's diets after weaning. Again in intervention group, male-headed households have been found to be predictors of Minimum Acceptable Diet, findings supported by a study conducted in 12 East African countries based on Demographic and Health Surveys (45).This may be explained by the fact that fathers frequently make important decisions in their families, which can positively affect the achievement of MAD.
In control group, married mothers and those who lived in cohabitation were more likely to achieve Minimum Acceptable Diet compared to single/ divorced and widowed. These results are consistent with other research' findings in North West and Tigray, Ethiopia, where married mothers were more likely to achieve MAD than single mothers (46, 47). The explanation could be that marriage plays a significant role in preserving better economic wellness which contributes to fulfil Minimum Acceptable Diet. Again in the control group, children from households where husbands were salaried employed were more likely to fulfil MAD compared to children from households where husbands were farmers. These findings may be explained by the possibility that families with salaried fathers are in a better socioeconomic position to achieve food security and, consequently, MAD.
In both intervention and control groups, children from households where fathers were educated were more likely to acquire Minimum Acceptable Diet compared to children from households where fathers were illiterate. The results of this study are consistent with those of a previous study carried out in Central Ethiopia, which discovered an association between Minimum Acceptable Diet and fathers' educational levels (48).
This study revealed that the level of uptake of nutrition intervention package was higher in intervention group than in control group probably as a result of a direct effect of combined nutrition intervention package in Gikuriro program.
Because some of the interventions related to IYCF practice, WASH activities, morbidity, and the use of health services that were assessed in this study have not been assessed at the end of Gikuriro program, this study provided more information about the level of uptake of nutrition intervention than in Gikuriro program. The implementers will be more aware of where to concentrate their efforts to lessen stunting thanks to this complementarity
The findings of this study can be compared to those of other research. For instance, in a quasi- experimental evaluation study conducted in Tanzania from 2016 to 2019, an integrated intervention program with a focus on routine nutrition services (nutrition education, education on infant feeding, iron and folic acid supplementation, and management of Severe Acute Malnutrition (SAM) was implemented. The study's target population included pregnant women and lactating mothers as well as children under the age of five. Pre-lacteal feeding, nursing within one hour, and exclusive breastfeeding from birth to six months were all shown to increase between baseline and end line surveys in this study (49).
Large population-based data which enabled to have stronger and more reliable results as they have smaller margins of error and lower standards of deviation.
Good participation rate: The high response rate lowered the difference between respondents and non-respondents which reduced the likelihood of response bias.
Recall bias could has been introduced especially because the mothers were asked to answer knowledge and practice questions towards IYCF and level of uptake of nutrition interventions retrospectively and they could have forgotten some of the key elements.
Before starting this research, Approval to conduct the study was obtained from the Institutional Review Board of the University of Rwanda College of Medicine and Health Sciences
Authorization for data collection on the field was obtained from the Ministry of Local Government. Informed consent was obtained from each participant.
The findings of this study have shown that integrated nutrition- specific and nutrition - sensitive intervention package as outlined in the study can improve practice of the mothers towards IYCF and as a result increasing the achievement of Minimum Acceptable Diet. This shows that they can make a significant contribution to alleviating the direct causes of stunting. Additionally, compared to the Gikuriro program, this study provided additional information regarding the level of uptake of nutrition interventions, resulting in a complementarity that might help implementers to determine where to concentrate their efforts in order to lessen stunting.
To assist policymakers improve child complementary feeding patterns and thereby address the issue of stunting, determinants of appropriate practice towards IYCF and of Minimum Acceptable Diet have been discovered.
Marc HABINEZA: conception of the work, design of the work, data collection supervision, data analysis, and interpretation, drafted manuscript. Maryse UMUGWANEZA: provided critical comments on the paper, Cyprien MUNYANSHONGORE: overall supervision, conceptualization, methodology review and manuscript review. All authors have read and approved the manuscript for publication
We acknowledge the financial support from Adventist School of Medicine (ASOME) and we would like to thank Rwanda Ministry of Local Government for allowing us to conduct the study and we thank the study participants and Community Health Workers for their cooperatio
The authors declare no conflicts of interest
The study was funded by Adventist School of Medicine (ASOME)
For scientific purpose, data will be requested through the following email address: habinezam@asome.health

![]()

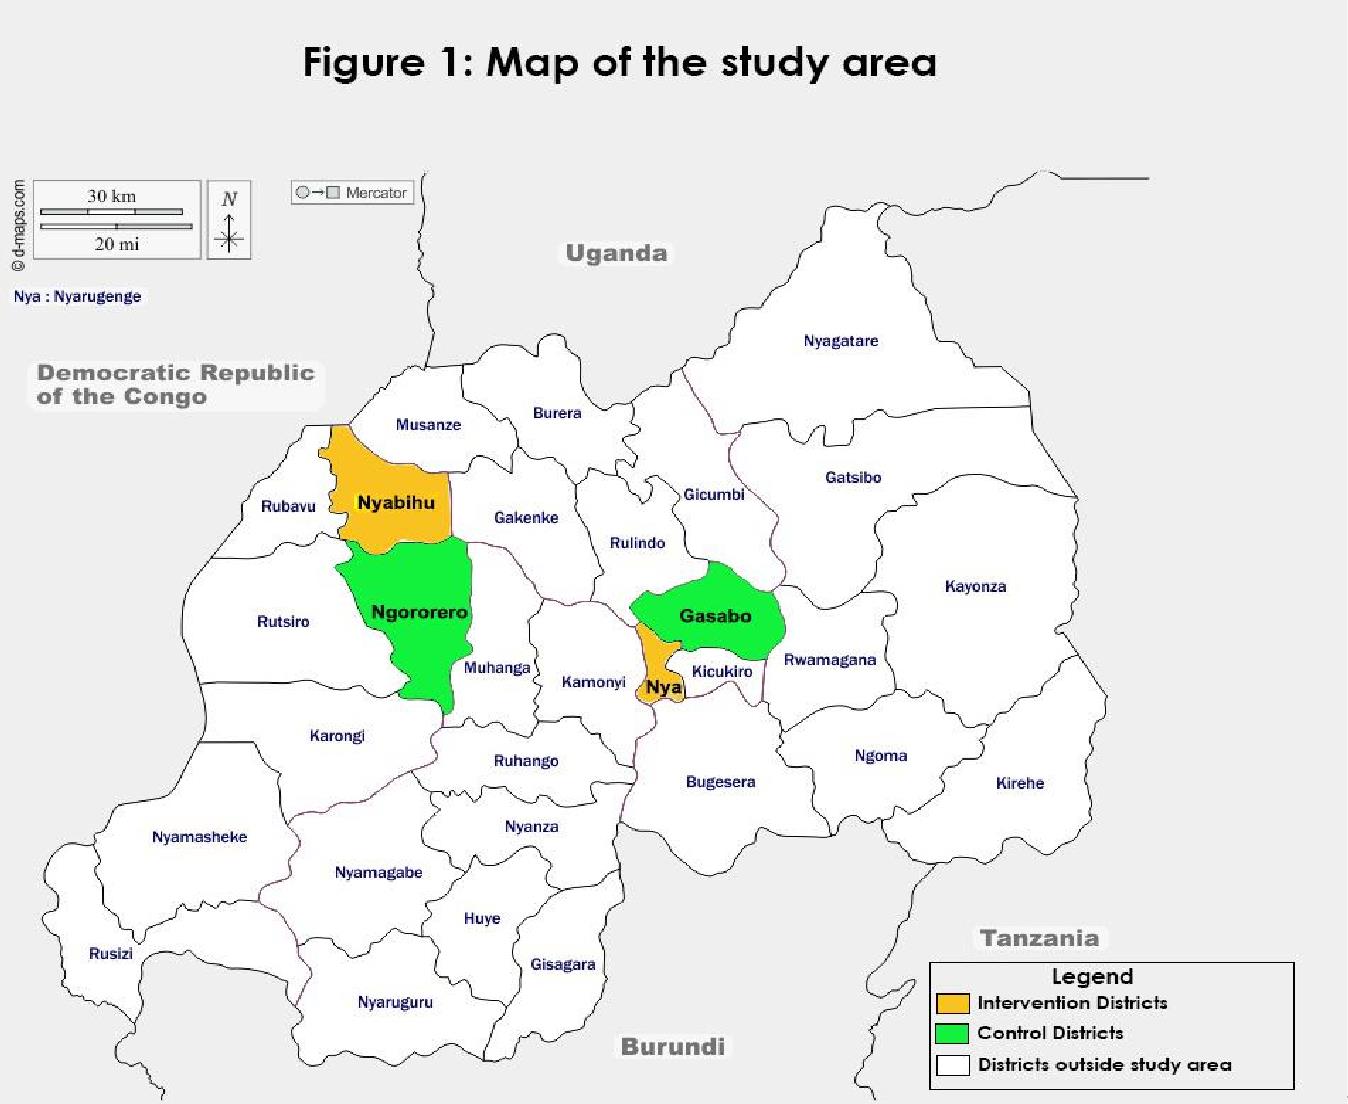 |
| Figure 1: Map of the Study Area |
 |
| Figure 2: Sample size calculation using G* Power |
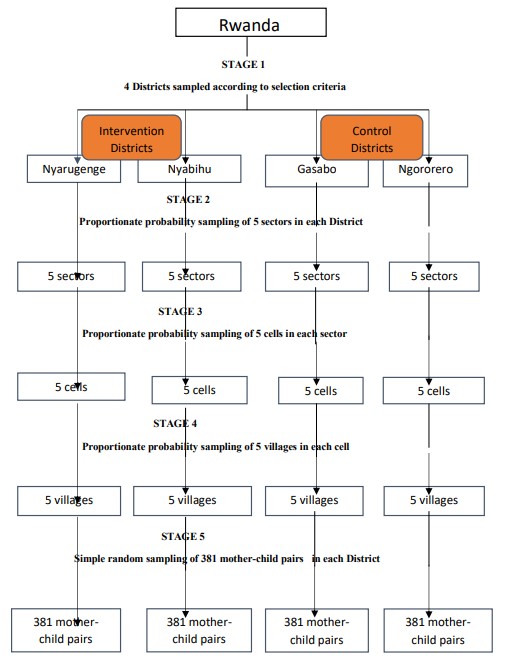 |
| Figure 3: Sample selection |
Characteristics |
Intervention |
Control |
Total(n=1526)%(n) |
χ2 |
p value |
|
|
|
|
|
|
|
|
|
|
|
|
|
|
|
|
|
|
Child’s sex |
|||||
Male |
49.93(381) |
50.46(385) |
50.20(766) |
0.042 |
0.838 |
Female |
50.07(382) |
49.54(378) |
49.80(760) |
|
|
Child's age( in months)<br> |
|||||
41-45 |
34.73(265) |
37.75(288) |
36.24(553) |
2.925 |
0.232 |
46-50 |
47.71 (364) |
47.57(363) |
47.64 (727) |
|
|
51-53 |
17.56 (134) |
14.68 (112) |
16.12 (246) |
|
|
Child’s order/rank among live siblings |
|||||
1-4 |
84.67 (646) |
88.20 (673) |
86.44(1319) |
4.615 |
0.099 |
5-8 |
14.94(114) |
11.27(86) |
13.11(200) |
|
|
9-11 |
0.39(3) |
0.53(4) |
0.45(7) |
|
|
Mother's age( in years) |
|||||
18-25 |
13.37(102) |
13.89(106) |
13.63(208) |
1.084 |
0.581 |
26-35 |
53.21(406) |
55.18(421) |
54.19(827) |
|
|
36 and above |
33.42(255) |
30.93(236) |
32.18(491) |
|
|
Number of family members living in the household |
|
||||
1 ˗5 |
59.11(451) |
66.19(505) |
62.65(956) |
12.757 |
0.002 |
6˗10 |
39.84(304) |
31.72(242) |
35.78 (546) |
|
|
11 ˗13 |
1.05(8) |
2.09(16) |
1.57(24) |
|
|
Mother's marital status |
|||||
Married and cohabiting |
81.65(623) |
76.14(581) |
78.90(1204) |
9.38 |
0.009 |
Single/divorced / widowed |
17.04(130) |
23.07(176) |
20.05(306) |
|
|
Others |
1.31(10) |
0.79(6) |
1.05(16) |
|
|
Mother's education |
|||||
Illiterate |
6.95(53) |
9.04(69) |
7.99(122) |
17.192 |
<.001 |
Primary level |
51.77(395) |
59.77(456) |
55.77(851) |
|
|
Secondary level and above |
41.28(315) |
31.19(238) |
36.24(553) |
|
|
Mother's religion |
|||||
Christian |
88.73(677) |
96.07(733) |
92.40(1410) |
46.531 |
<.001 |
Muslim |
9.04(69) |
1.31(10) |
5.18(79) |
|
|
Others |
2.23(17) |
2.62(20) |
2.42(37) |
|
|
Mother's residence |
|||||
Urban |
59.50(454) |
60.29(460) |
59.89(914) |
0.098 |
0.754 |
Rural |
40.50(309) |
39.71(303) |
40.11(612) |
|
|
Mother's age when she got married |
|||||
15-25 |
82.19(623) |
81.22(614) |
81.71(1237) |
0.443 |
0.801 |
26-35 |
17.28(131) |
18.38(139) |
17.83(270) |
|
|
36 and above |
0.53(4) |
0.40(3) |
0.46(7) |
|
|
Mother's age when she had her first baby |
|||||
15-25 |
76.54(584) |
76.28(582) |
76.41(1166) |
0.121 |
0.942 |
26-35 |
22.67(173) |
23.07(176) |
22.87(349) |
|
|
36 and above |
0.79(6) |
0.65(5) |
0.72(11) |
|
|
Mother's age when she had the current child |
|||||
15-25 |
33.42(255) |
33.95(259) |
33.68(514) |
2.295 |
0.317 |
26-35 |
49.93(381) |
52.16(398) |
51.05(779) |
|
|
36 and above |
16.65(127) |
13.89(106) |
15.27(233) |
|
|
Number of children the mother has given birth to |
|||||
1 ˗5 |
89.25(681) |
91.09(695) |
90.17(1376) |
2.006 |
0.367 |
6˗10 |
10.62(81) |
8.65(66) |
9.63(147) |
|
|
11 and above |
0.13(1) |
(0.26)(2) |
0.20(3) |
|
|
Number of children still alive today |
|||||
1 ˗5 |
91.61(699) |
92.66(707) |
92.14(1406) |
0.588 |
0.745 |
6˗10 |
8.26 (63) |
7.21(55) |
7.73(118) |
|
|
11 and above |
0.13(1) |
0.13(1) |
0.13(2) |
|
|
Number of children under 5 years |
|||||
1˗2 |
98.03(748) |
98.03(748) |
98.03(1496) |
0 |
1 |
3˗5 |
1.97(15) |
1.97(15) |
1.97(30) |
|
|
Birth interval between the current child and the previous birth |
|||||
1 ˗5 |
85.30(534) |
85.74(499) |
85.51(1033) |
0.046 |
0.977 |
6˗10 |
14.70(92) |
14.26(83) |
14.49(175) |
|
|
Gender of head of household |
|||||
Male |
79.42(606) |
72.08(550) |
75.76(1156) |
11.188 |
˂ .001 |
Female |
20.58(157) |
27.92(213) |
24.24(370) |
|
|
Occupation of the mother |
|||||
Farming/agriculture |
37.74(288) |
49.93(381) |
43.84(66)9 |
24.626 |
< .001 |
Self employed |
41.55(317) |
31.32(239) |
(36.44)(556) |
|
|
Salaried employed |
3.54(27) |
3.28(25) |
3.41(52) |
|
|
Unemployed |
17.17(131) |
15.47(118) |
16.32(249) |
|
|
Husband’s education |
|||||
Illiterate |
10.49(80) |
12.06(92) |
11.27(172) |
47.918 |
< .001 |
Primary level |
47.44(362) |
62.52(477) |
54.98(839) |
|
|
Secondary and above |
42.07(321) |
25.42(194) |
33.75(515) |
|
|
Occupation of the father |
|||||
Farming/agriculture |
21.75(166) |
36.57(279) |
29.16(445) |
54.26 |
< .001 |
Self employed |
52.69(402) |
35.91(274) |
44.30(676) |
|
|
Salaried |
12.19(93) |
11.93(91) |
12.06(184) |
|
|
Unemployed |
13.37(102) |
15.59(119) |
14.48(221) |
|
|
Household 's wealth Index |
|||||
Category 1 |
8.26(63) |
11.66(89) |
9.96(152) |
6.815 |
0.033 |
Category 2 |
51.51(393) |
52.82(403) |
52.16(796) |
|
|
Category 3 |
40.23(307) |
35.52(271) |
37.88(578) |
|
|
Characteristics |
Intervention group |
Control group |
Total |
χ2 |
p value |
Initiation of breastfeeding within one hour after birth |
|||||
Yes ( know) |
97.12(741) |
97.51(744) |
97.31(1485) |
0.225 |
0.634 |
No (does not know) |
2.88(22) |
2.49(19) |
2.69(41) |
|
|
Exclusive breastfeeding up to 6 months |
|||||
Yes(Know ) |
96.59(737) |
97.12(741) |
96.85(1478) |
0.344 |
0.557 |
No(does not know ) |
3.41(26) |
2.88(22) |
3.15(48) |
|
|
Continuing breastfeeding for 24 months or more |
|||||
Yes ( know) |
96.07(733) |
96.98(740) |
96.53(1473) |
0.958 |
0.328 |
No( does not know) |
3.93(30) |
3.02(23) |
3.47(53) |
|
|
Initiation of complementary feeding by 6 months |
|||||
Initiation of liquid food at 6 months |
|||||
Yes ( know) |
49.54(378) |
57.54(439) |
53.54(817) |
9.803 |
0.0017 |
No( does not know) |
50.46(385) |
42.46(324) |
46.46(709) |
|
|
Initiation of semi solid food by 7-8 months |
|||||
Yes ( know) |
41.15(314) |
41.55(317) |
41.35(631) |
0.024 |
0.876 |
No( does not know) |
58.85(449) |
58.45(446) |
58.65(895) |
|
|
Initiation of solid food from 9 months |
|||||
Yes(Know ) |
7.86(60) |
20.58(157) |
14.22(217) |
50.55 |
< .001 |
No(does not know) |
92.14(703) |
79.42(606) |
85.78(1309) |
|
|
Having 5 and more groups of food in a day(MDD) |
|||||
Yes(Know) |
5.50(42) |
8.39(64) |
6.95(106) |
4.907 |
0.027 |
No( does not know) |
94.50(721) |
91.61(699) |
93.05(1420) |
|
|
Giving food 3 times a day and more (MMF) |
|||||
Yes ( know) |
96.20(734) |
93.32(712) |
94.76(1446) |
6.385 |
0.012 |
No( does not know) |
3.80(29) |
6.68(51) |
5.24(80) |
|
|
Having 5 and more groups of food and giving food 3 times and more in a day(MAD) |
|||||
Yes(Knows) |
4.85(37) |
7.73(59) |
6.29(96) |
5.381 |
0.021 |
No( does not know) |
95.15(726) |
92.27(704) |
93.71(1430) |
|
|
Micronutrients help our bodies to be in good health and to fight against malnutrition |
|||||
Yes(Knows) |
99.74(761) |
97.25(742) |
98.49(1503) |
15.94 |
< .001 |
No( does not know) |
0.26(2) |
2.75(21) |
1.51(23) |
|
|
Mothers with Comprehensive knowledge on IYCF |
|||||
Yes(Know ) |
3.15(24) |
10.62(81) |
6.88(105) |
|
|
No( Don't know ) |
96.85(739) |
89.38(682) |
93.12(1421) |
33.23 |
< .001 |
Characteristics |
Intervention |
Control |
Total |
χ2 |
p value |
|
|
|
|
|
|
|
|
|
|
|
|
Breastfeeding |
|
|
|
|
|
Yes |
99.34(758) |
99.08(756) |
99.21(1514) |
0.336 |
0.562 |
No |
0.66(5) |
0.92(7) |
0.79(12) |
|
|
Breastfeeding less than 6 months |
|||||
Yes |
0.79(6) |
1.98(15) |
1.39(21) |
3.935 |
0.0472 |
No |
99.21(752) |
98.02(741) |
98.61(1493) |
|
|
Breastfeeding until 24 months |
|||||
Yes |
53.03(402) |
37.17(281) |
45.11(683) |
38.475 |
< 0 .001 |
No |
46.97(356) |
62.83(475) |
54.89(831) |
|
|
Breastfeeding 24 months and more |
|||||
Yes |
83.51(633) |
80.69(610) |
82.10(1243) |
2.05 |
0.152 |
No |
16.49(125) |
19.31(146) |
17.90(271) |
|
|
Initiation of breastfeeding within one hour after birth |
|||||
Yes |
94.46(716) |
91.53(692) |
93.00(1408) |
4.972 |
0.026 |
No |
5.54(42) |
8.47(64) |
7.00(106) |
|
|
Exclusive breastfeeding for 6 months |
|||||
Yes |
92.21(699) |
89.28(675) |
90.75(1374) |
3.871 |
0.049 |
No |
7.79(59) |
10.72(81) |
9.25(140) |
|
|
Initiation of complementary feeding below 6 months |
|||||
Yes |
7.34(56) |
9.04(69) |
8.19(125) |
1.472 |
0.224 |
No |
92.66(707) |
90.96(694) |
91.81(1401) |
|
|
Initiation of complementary feeding at 6 months |
|||||
Yes |
68.55(523) |
64.48(492) |
66.51(1015) |
2.827 |
0.093 |
No |
31.45(240) |
35.52(271) |
33.49(511) |
|
|
Initiation Semi solid foods at 7-8 months |
|||||
Yes |
48.23(368) |
45.48(347) |
46.85(715) |
1.236 |
0.266 |
No |
51.77(395) |
54.52(416) |
53.15(811) |
|
|
Initiation of solid food from 9 months |
|||||
Yes |
9.83(75) |
20.18(154) |
15.01(229) |
32.065 |
< 0.001 |
No |
90.17( 688) |
79.82(609) |
84.99(1297) |
|
|
Appropriate practice of mothers towards IYCF |
|||||
Yes |
53.87(411) |
48.62(371) |
51.25(782) |
4.197 |
0.041 |
No |
46.13(352) |
51.38(392) |
48.75(744) |
|
|
Minimum Dietary Diversity(MDD) |
|||||
Yes |
29.36(224) |
24.77(189) |
27.00(413) |
4.066 |
0.044 |
No |
70.64(539) |
75.23(574) |
73.00(1112) |
|
|
Minimum Meal Frequency( MMF) |
|||||
Yes |
59.76(456) |
52.82(403) |
56.29(859) |
7.481 |
0.006 |
No |
40.24(307) |
47.18(360) |
43.71(667) |
|
|
Minimum Acceptable Diet (MAD) |
|||||
Yes |
23.33(178) |
18.09(138) |
20.71(316) |
6.386 |
0.011 |
No |
76.67(585) |
81.91(625) |
79.29(1210) |
|
|
Intervention group |
Control group |
||||||||||
Variables |
Yes |
No |
Total |
χ2 |
P value |
Yes |
No |
Total |
χ2 |
P value |
|
|
|
|
|
|
|
|
|
|
|
|
|
Child’s sex |
|
|
|
|
|
|
|
|
|
||
Female |
52.9(202) |
47.1(180) |
100.0(382) |
0.3 |
0.584 |
48.1(182) |
51.9(196) |
100.0(378) |
0.068 |
0.794 |
|
Male |
54.9(209) |
45.1(172) |
100.0(381) |
|
|
49.1(189) |
50.9(196) |
100.0(385) |
|
|
|
Child's age(months) |
|||||||||||
41-45 |
54.7(145) |
45.3(120) |
100.0(265) |
0.391 |
0.823 |
48.6(140) |
51.4(148) |
100.0(288) |
0.013 |
0.993 |
|
46-50 |
54.1(197) |
45.9(167) |
100.0(364) |
|
|
48.5(176) |
51.5(187) |
100.0(363) |
|
|
|
51-53 |
51.5(69) |
48.5(65) |
100.0(134) |
|
|
49.1(55) |
50.9(57) |
100.0(112) |
|
|
|
Number of family members |
|||||||||||
1 ˗5 |
52.5(237) |
47.5(214) |
100.0(451) |
1.991 |
0.37 |
50.3(254) |
49.7(251) |
100.0(505) |
1.821 |
0.402 |
|
6˗10 |
55.3(168) |
44.7(136) |
100.0(304) |
|
|
45.0(109) |
55.0(133) |
100.0(242) |
|
|
|
11 ˗13 |
75.0(6) |
25.0(2) |
100.0(8) |
|
|
50.0(8) |
50.0(8) |
100.)(16) |
|
|
|
Child's order/rank among live siblings |
|||||||||||
1 ˗4 |
53.1(343) |
46.9(303) |
100.0(646) |
3.179 |
0.204 |
48.4(326) |
51.6(347) |
100.0(673) |
0.077 |
0.962 |
|
5˗8 |
57.0(65) |
43.0(49) |
100.09114) |
|
|
50.0(43) |
50.0(43) |
100.0(86) |
|
|
|
9 ˗11 |
100.0(3) |
0.0(0) |
100.0(3) |
|
|
50.0(2) |
50.0(2) |
100.0(4) |
|
|
|
Age of the mother (years) |
|||||||||||
18-25 |
45.1(46) |
54.9(56) |
100.0(102) |
6.311 |
0.043 |
35.8(38) |
64.2(68) |
100.0(106) |
8.111 |
0.017 |
|
26-35 |
52.7(214) |
47.3(192) |
100.0(406) |
|
|
51.1(215) |
48.9(206) |
100.0(421) |
|
|
|
36 and above |
59.2(151) |
40.8(104) |
100.0(255) |
|
|
50.0(118) |
50.0(118) |
100.0(236) |
|
|
|
Marital status of the mother |
|||||||||||
Married and cohabitation |
55.7(347) |
44.3(276) |
100..0(623) |
5.47 |
0.065 |
50.3(292) |
49.7(289) |
100.0(581) |
2.856 |
0.24 |
|
Single/Divorced/Widowed |
44.6(58) |
55.4(72) |
100.0(130) |
|
|
43.8(77) |
56.2(99) |
100.0(176) |
|
|
|
Others |
60.0(6) |
40.0(4) |
100.0(10) |
|
|
33.3(2) |
66.7(4) |
100.0(6) |
|
|
|
Mother's education |
|||||||||||
Illiterate |
58.5(31) |
41.5(22) |
100.0(53) |
5.379 |
0.068 |
56.5(39) |
43.5(30) |
100.0(69) |
1.928 |
0.381 |
|
Primary level |
57.2(226) |
42.8(169) |
100.0(395) |
|
|
47.6(217) |
52.4(239) |
100.0(456) |
|
|
|
Secondary level and above |
48.9(154) |
51.1(161) |
100.0(315) |
|
|
48.3(115) |
51.7(123) |
100.0(238) |
|
|
|
Religion of the mother |
|||||||||||
Christian |
53.2(360) |
46.8(317) |
100.0(677) |
1.498 |
0.473 |
48.6(356) |
51.4(377) |
100.0(733) |
0.024 |
0.988 |
|
Muslim |
60.9(42) |
39.1(27) |
100.0(69) |
|
|
50.0(5) |
50.0(5) |
100.0(10) |
|
|
|
Others |
52.9(9) |
47.1(8) |
100.0(17) |
|
|
50.0(10) |
50.0(10) |
100.0920) |
|
|
|
Place of the residence |
|||||||||||
Rural |
57.0(176) |
43.0(133) |
100.0(309) |
1.997 |
0.158 |
59.4(180) |
40.6(123) |
100.0(303) |
23.39 |
0 |
|
Urban |
51.8(235) |
48.2(219) |
100.0(454) |
|
|
41.5(191) |
58.5(269) |
100.0(460) |
|
|
|
Mother's age when got married |
|||||||||||
15-25 |
54.7(341) |
45.3(282) |
100.0(623) |
1.857 |
0.395 |
49.3(303) |
50.7(311) |
100.0(614) |
0.531 |
0.767 |
|
26-35 |
49.6(65) |
50.4(66) |
100.0(131) |
|
|
47.5(66) |
52.5(73) |
100.0(139) |
|
|
|
36 and above |
75.0(3) |
25.0(1) |
100.0(4) |
|
|
66.7(2) |
33.3(1) |
100.0(3) |
|
|
|
Mother's age first baby |
|||||||||||
15-25 |
53.8(314) |
46.2(270) |
100.0(584) |
0.054 |
0.974 |
48.6(283) |
51.4(299) |
100.0(582) |
2.027 |
0.363 |
|
26-35 |
54.3(94) |
45.7(79) |
100.0(173) |
|
|
47.7(84) |
52.3(92) |
100.0(176) |
|
|
|
36 and above |
50.0(3) |
50.0(3) |
100.0(6) |
|
|
80.0(4) |
20.0(1) |
100.0(5) |
|
|
|
Mother's age current baby |
|||||||||||
15-25 |
45.5(116) |
54.5(139) |
100.0(255) |
10.94 |
0.004 |
48.3(125) |
51.7(134) |
100.0(259) |
2.542 |
0.28 |
|
26-35 |
58.5(223) |
41.5(158) |
100.0(381) |
|
|
47.0(187) |
53.0(211) |
100.0(398) |
|
||
36 and above |
56.7(72) |
43.3(55) |
100.0(127) |
|
55.7(59) |
44.3(47) |
100.0(106) |
|
|||
Number of children given birth to |
|||||||||||
1 ˗5 |
54.9(368) |
46.0(313) |
100.0(681) |
0.997 |
0.607 |
48.9(340) |
51.1(355) |
100.0(695) |
0.291 |
0.864 |
|
6˗10 |
51.9(42) |
48.1(39) |
100.0(81) |
|
|
45.5(30) |
54.5(36) |
100.0(66) |
|
|
|
11 and above |
100.0(1) |
0.0(0) |
100.0(1) |
|
|
50.0(1) |
50.0(1) |
100.0(2) |
|
|
|
Number of children under 5 years |
|||||||||||
1 ˗2 |
54.7(409) |
45.3(339) |
100.0(748) |
10.12 |
0.001 |
49.3(369) |
50.7(379) |
100.0(748) |
7.628 |
0.006 |
|
3˗5 |
13.3(2) |
86.7(13) |
100.0(15) |
|
|
13.3(2) |
86.7(13) |
100.0(15) |
|
|
|
Birth interval with the previous birth |
|||||||||||
1 ˗5 |
53.9(288) |
46.1(246) |
100.0(534) |
0.794 |
0.373 |
47.9(239) |
52.1(260) |
100.0(499) |
0.436 |
0.509 |
|
6˗10 |
48.9(45) |
51.1(47) |
100.0(92) |
|
|
51.8(43) |
48.2(40) |
100.0(83) |
|
|
|
Number of children alive today |
|||||||||||
1 ˗5 |
54.4(380) |
45.6(319) |
100.0(699) |
1.915 |
0.384 |
48.7(344) |
51.3(363) |
100.0(707) |
1.097 |
0.578 |
|
6˗10 |
47.6(30) |
52.4(33) |
100.0(63) |
|
|
47.3(26) |
52.7(29) |
100.0(55) |
|
|
|
11 and above |
100.0(1) |
0.0(0) |
100.0(1) |
|
|
100.0(1) |
0.0(0) |
100.0(1) |
|
|
|
Gender of the Head of household |
|||||||||||
Female |
47.8(75) |
52.2(82) |
100.0(157) |
2.956 |
0.086 |
44.6(95) |
55.4(118) |
100.0(213) |
1.914 |
0.166 |
|
Male |
55.4(336) |
44.6(270) |
100.0(606) |
|
|
50.2(276) |
49.8(274) |
100.0(550) |
|
|
|
Occupation of the mother |
|||||||||||
Farming/agriculture |
59.4(171) |
40.6(117) |
100.0(288) |
6.038 |
0.11 |
56.7(216) |
43.3(165) |
100.0(381) |
24.63 |
0 |
|
Self employed |
49.5(157) |
50.5(160) |
100.0(317) |
|
|
44.4(106) |
55.6(133) |
100.0(239) |
|
|
|
Salaried employed |
51.9(14) |
48.1(13) |
100.0(27) |
|
|
44.0(11) |
56.0(14) |
100.0(25) |
|
|
|
Unemployed |
52.7(69) |
47.3(62) |
100.0(131) |
|
|
32.2(38) |
67.8(80) |
100.0(118) |
|
|
|
Husband's education |
|||||||||||
Illiterate |
52.5(42) |
47.5(38) |
100.0(80) |
1.043 |
0.594 |
52.2(48) |
47.8(44) |
100.0(92) |
1.37 |
0.504 |
|
Primary level |
55.8(202) |
44.2(160) |
100.0(362) |
|
|
49.3(235) |
50.7(242) |
100.0(477) |
|
|
|
Secondary level and above |
52.0(167) |
48.0(154) |
100.0(321) |
|
|
45.4(88) |
54.6(106) |
100.0(194) |
|
|
|
Occupation of the father |
|||||||||||
Farming/agriculture |
57.8(96) |
42.2(70) |
100.0(166) |
6.746 |
0.08 |
62.4(174) |
37.6(105) |
100.0(279) |
33.3 |
0 |
|
Self employed |
55.7(224) |
44.3(178) |
100.0(402) |
|
|
40.5(111) |
59.5(163) |
100.0(274) |
|
|
|
Salaried employed |
50.5(47) |
49.5(46) |
100.0(93) |
|
|
41.8(38) |
58.2(53) |
100.0(91) |
|
|
|
Unemployed |
43.1(44) |
56.9(58) |
100.0(102) |
|
|
40.3(48) |
59.7(71) |
100.0(119) |
|
|
|
Wealth index |
|||||||||||
Category 1 |
42.9(27) |
57.1(36) |
100.0(63) |
7.66 |
0.022 |
50.6(45) |
49.4(44) |
100.0(89) |
0.75 |
0.687 |
|
Category 2 |
51.4(202) |
48.6(191) |
100.0(307) |
|
|
47.1(190) |
52.9(213) |
100.0(403) |
|
|
|
Category 3 |
59.3(182) |
40.7(125) |
100.0(307) |
|
|
50.2(136) |
49.8(135) |
100.0(271) |
|
|
|
Comprehensive knowledge on IYCF |
|||||||||||
No |
53.5(395) |
46.5(344) |
100.0(739) |
1.634 |
0.201 |
46.9(320) |
53.1(362) |
100.0(682) |
7.459 |
0.006 |
|
Yes |
66.7(16) |
33.3(8) |
100.0(24) |
|
|
63.0(51) |
37.0(30) |
100.0(81) |
|
|
|
|
|
|
|
|
|
|
|
|
Control group |
|
|
|
|
|||||||||||||||||||||||||||||||||
|
|
|
|
|
|
p |
|
|
p |
|
|
|
|
|
|
|
p |
|
|
p |
||||||||||||||||||||||||||
Variables |
Yes |
No |
Total |
COR |
CI at 95% |
value |
AOR |
CI at 95% |
value |
Yes |
No |
|
Total |
|
COR |
CI at 95% |
value |
AOR |
|
CI at 95% |
|
value |
||||||||||||||||||||||||
|
%(n) |
%(n) |
%(n) |
|
|
|
|
|
|
%(n) |
%(n) |
|
%(n) |
|
|
|
|
|
|
|
|
|
||||||||||||||||||||||||
|
|
|
|
|
|
|
|
|
|
|
|
|
|
|
|
|
|
|
|
|
|
|
||||||||||||||||||||||||
Age of the mother (years) |
|
|
|
|
|
|
|
|
|
|
|
|
|
|||||||||||||||||||||||||||||||||
|
|
|
|
|
|
|
|
|
|
|
|
|
|
|
|
|
||||||||||||||||||||||||||||||
18-25 |
|
45.1(46) |
|
54.9(56) |
|
100.0(102) |
1 |
|
|
1 |
|
|
35.8(38) |
64.2(68) |
|
100.0(106) |
|
1 |
|
|
1 |
|
|
|
|
|||||||||||||||||||||
26-35 |
|
52.7(214) |
|
47.3(192) |
|
100.0(406) |
1.357 |
0.877-2.098 |
0.170 |
0.996 |
0.600-1.652 |
0.987 |
51.1(215) |
48.9(206) |
|
100.0(421) |
|
1.868 |
1.202-2.902 |
0.005 |
1.969 |
|
1.227- 3.159 |
|
0.005 |
|||||||||||||||||||||
36 and above |
|
59.2(151) |
|
40.8(104) |
|
100.0(255) |
1.768 |
1.112-2.809 |
0.016 |
1.215 |
0.634-2.330 |
0.558 |
50.0(118) |
50.0(118) |
|
100.0(236) |
|
1.789 |
1.116-2.869 |
0.016 |
1.557 |
|
0.933-2.600 |
|
0.090 |
|||||||||||||||||||||
Mother's age current baby |
|
|
|
|
|
|
|
|
|
|
|
|
|
|||||||||||||||||||||||||||||||||
15-25 |
45.5(116) |
54.5(139) |
100.0(255) |
1 |
|
|
1 |
|
|
|
|
|
|
|
|
|
|
|
|
|
|
|
||||||||||||||||||||||||
26-35 |
58.5(223) |
41.5(158) |
100.0(381) |
1.691 |
1.228-2.329 |
0.001 |
1.549 |
1.041-2.305 |
0.031 |
|
|
|
|
|
|
|
|
|
|
|
|
|
||||||||||||||||||||||||
36 and above |
56.7(72) |
43.3(55) |
100.0(127) |
1.569 |
1.022-2.409 |
0.040 |
1.196 |
0.638-2.241 |
0.578 |
|
|
|
|
|
|
|
|
|
|
|
|
|
||||||||||||||||||||||||
Number of children under 5 years |
|
|
|
|
|
|
|
|
|
|
|
|
|
|||||||||||||||||||||||||||||||||
1-2 |
54.7(409) |
45.3(339) |
100.0(748) |
7.842 |
1.757-34.993 |
0.007 |
8.135 |
1.808-36.603 |
0.006 |
49.3(369) |
50.7(379) |
|
100.0(748) |
|
6.328 |
1.418- |
0.016 |
6.329 |
|
1.377-29.089 |
|
0.018 |
||||||||||||||||||||||||
3-5 |
13.3(2) |
86.7(13) |
100.0(15) |
1 |
|
|
1 |
|
|
13.3(2) |
86.7(13) |
|
100.0(15) |
|
1 |
|
|
1 |
|
|
|
|
||||||||||||||||||||||||
Wealth index |
|
|
|
|
|
|
|
|
|
|
|
|
|
|
|
|
|
|
|
|
|
|
||||||||||||||||||||||||
Category 1 |
42.9(27) |
57.1(36) |
100.0(63) |
1 |
|
|
1 |
|
|
|
|
|
|
|
|
|
|
|
|
|
|
|
||||||||||||||||||||||||
Category 2 |
51.4(202) |
48.6(191) |
100.0(307) |
1.410 |
0.824-2.412 |
0.210 |
1.410 |
0.818-2.430 |
0.216 |
|
|
|
|
|
|
|
|
|
|
|
|
|
||||||||||||||||||||||||
Category 3 |
59.3(182) |
40.7(125) |
100.0(307) |
1.941 |
1.122-3.360 |
0.018 |
1.792 |
1.026-3.130 |
0.040 |
|
|
|
|
|
|
|
|
|
|
|
|
|
||||||||||||||||||||||||
Occupation of the mother |
|
|
|
|
|
|
|
|
|
|
|
|
|
|||||||||||||||||||||||||||||||||
Farming/agriculture |
|
|
|
|
|
|
|
|
56.7(216) |
43.3(165) |
|
100.0(381) |
|
2.756 |
1.782-4.263 |
0.000 |
1.489 |
|
0.861-2.578 |
|
0.155 |
|||||||||||||||||||||||||
Self employed |
|
|
|
|
|
|
|
|
|
44.4(106) |
55.6(133) |
|
100.0(239) |
|
1.678 |
1.056-2.665 |
0.028 |
1.686 |
|
1.046-2.717 |
|
0.032 |
||||||||||||||||||||||||
Salaried employed |
|
|
|
|
|
|
|
|
|
44.0(11) |
56.0(14) |
|
100.0(25) |
|
1.654 |
0.687-3.984 |
0.262 |
1.315 |
|
0.520-3.329 |
|
0.563 |
||||||||||||||||||||||||
Unemployed |
|
|
|
|
|
|
|
|
|
32.2(38) |
67.8(80) |
|
100.0(118) |
|
1 |
|
|
1 |
|
|
|
|
||||||||||||||||||||||||
Occupation of the father |
|
|
|
|
|
|
|
|
|
|
|
|
|
|||||||||||||||||||||||||||||||||
Farming/agriculture |
|
|
|
|
|
|
|
|
56.7(216) |
43.3(165) |
|
100.0(381) |
|
2.451 |
1.580-3.803 |
0.000 |
1.841 |
|
1.060-3.197 |
|
0.030 |
|||||||||||||||||||||||||
Self employed |
|
|
|
|
|
|
|
|
|
44.4(106) |
55.6(133) |
|
100.0(239) |
|
1.007 |
0.650-1.562 |
0.974 |
0.939 |
|
0.589-1.498 |
|
0.793 |
||||||||||||||||||||||||
Salaried employed |
|
|
|
|
|
|
|
|
|
44.0(11) |
56.0(14) |
|
100.0(25) |
|
1.061 |
0.609-1.847 |
0.835 |
0.849 |
|
0.463-1.557 |
|
0.597 |
||||||||||||||||||||||||
Unemployed |
|
|
|
|
|
|
|
|
|
32.2(38) |
67.8(80) |
|
100.0(118) |
|
1 |
|
|
1 |
|
|
|
|
||||||||||||||||||||||||
Comprehensive knowledge on IYCF |
|
|
|
|
|
|
|
|
|
|
|
|
|
|||||||||||||||||||||||||||||||||
No |
|
|
|
|
|
|
|
|
|
46.9(320) |
53.1(362) |
|
100.0(682) |
|
1 |
|
|
1 |
|
|
|
|
||||||||||||||||||||||||
Yes |
|
|
|
|
|
|
|
|
|
63.0(51) |
37.0(30) |
|
100.0(81) |
|
1.923 |
1.196-3.094 |
0.007 |
2.374 |
|
1.420-3.968 |
|
0.001 |
||||||||||||||||||||||||
Place of the residence |
|
|
|
|
|
|
|
|
|
|
|
|
|
|||||||||||||||||||||||||||||||||
Rural |
|
|
|
|
|
|
|
|
|
59.4(180) |
40.6(123) |
|
100.0(303) |
|
2.061 |
1.535-2.768 |
0.000 |
1.435 |
|
0.953-2.161 |
|
0.084 |
||||||||||||||||||||||||
Urban |
|
|
|
|
|
|
|
|
|
41.5(191) |
58.5(269) |
|
100.0(460) |
|
1 |
|
|
1 |
|
|
|
|
||||||||||||||||||||||||
Intervention group |
p |
Control group |
p |
|||||||
Variables |
Yes |
No |
Total |
χ2 |
P value |
Yes |
No |
Total |
χ2 |
P value |
|
|
|
|
|
|
|
|
|
|
|
Child’s sex |
|
|||||||||
Female |
27.2(104) |
72.8(278) |
100.0(382) |
6.492 |
0.011 |
17.2(65) |
82.8(313) |
100.0(378) |
0.401 |
0.526 |
Male |
19.4(74) |
80.6(307) |
100.0(381) |
|
|
19.0(73) |
81.0(312) |
100.0(385) |
|
|
Child's age(months) |
||||||||||
41-45 |
30.2(80) |
69.8(185) |
100.0(265) |
18.06 |
0 |
19.4(56) |
80.6(232) |
100.0(288) |
7.943 |
0.019 |
46-50 |
22.8(83) |
77.2(281) |
100.0(364) |
|
|
14.6(53) |
85.4(310) |
100.0(363) |
|
|
51-53 |
11.2(15) |
88.8(119) |
100.0(134) |
|
|
29.9(29) |
74.1(83) |
100.0(112) |
|
|
Number of family members |
||||||||||
1 ˗5 |
23.9(108) |
76.1(343) |
100.0(451) |
0.266 |
0.876 |
18.8(95) |
81.2(410) |
100.0(505) |
1.33 |
0.514 |
6˗10 |
22.4(68) |
77.6(236) |
100.0(304) |
|
16.1(39) |
83.9(203) |
100.0(242) |
|
|
|
11 ˗13 |
25.0(2) |
75.0(6) |
100.0(8) |
|
|
25.0(4) |
75.0(12) |
100.0(16) |
|
|
Child's order/rank among live siblings |
||||||||||
1 ˗4 |
23.7(153) |
76.3(493) |
100.0(646) |
1.083 |
0.582 |
18.6(125) |
81.4(548) |
100.0(673) |
1.228 |
0.541 |
5˗8 |
21.9(25) |
78.1(89) |
100.0(114) |
|
|
14.0(12) |
86.0(74) |
100.0(86) |
|
|
9 ˗11 |
0.0(0) |
100.0(3) |
100..0(3) |
|
|
25.0(1) |
75.0(3) |
100.0(4) |
|
|
Age of the mother (years) |
||||||||||
18-25 |
24.5(25) |
75.5(77) |
100.0(102) |
0.231 |
0.891 |
11.3(12) |
88.7(94) |
100.0(106) |
9.463 |
0.009 |
26-35 |
22.7(92) |
77.3(314) |
100.0(406) |
|
|
21.9(92) |
78.1(329) |
100.0(421) |
|
|
36 and above |
23.9(61) |
76.1(194) |
100.0(255) |
|
|
14.4(34) |
85.6(202) |
100.0(236) |
|
|
Marital status of the mother |
||||||||||
Married and cohabitation |
24.6(153) |
75.4(470) |
100.0(623) |
2.898 |
0.235 |
20.3(118) |
79.7(463) |
100.0(581) |
8.262 |
0.016 |
Single/Divorced/Widowed |
17.7(23) |
82.3(107) |
100.0(130) |
|
|
10.8(19) |
89.2(157) |
100.0(176) |
|
|
Others |
20.0(2) |
80.0(8) |
100.0(10) |
|
|
16.7(1) |
83.3(5) |
100.0(6) |
|
|
Mother's education |
||||||||||
Illiterate |
11.3(6) |
88.7(47) |
100.0(53) |
24.04 |
0 |
7.2(5) |
92.8(64) |
100.0(69) |
63.171 |
0 |
Primary level |
18.0(71) |
82.0(324) |
100.0(395) |
|
|
11.2(51) |
88.8(405) |
100.0(456) |
|
|
Secondary level |
32.1(101) |
67.9(214) |
100.0(315) |
|
|
34.5(82) |
65.5(156) |
100.0(238) |
|
|
Mother's religion |
||||||||||
Christian |
23.8(161) |
76.2(516) |
100.0(677) |
2.971 |
0.226 |
17.9(131) |
82.1(602) |
100.0(733) |
3.393 |
0.183 |
Muslim |
23.2(16) |
76.8(53) |
100.0(69) |
|
|
40.0(4) |
60.0(6) |
100.0(10) |
|
|
Others |
5.9(1) |
94.1(16) |
100.0(17) |
|
|
15.0(3) |
85.0(17) |
100.0(20) |
|
|
Place of the residence |
||||||||||
Rural |
17.5(54) |
82.5(255) |
100.0(309) |
9.947 |
0.002 |
12.9(39) |
87.1(264) |
100.0(303) |
9.227 |
0.002 |
Urban |
27.3(124) |
72.7(330) |
100.0(454) |
|
|
21.5(99) |
78.5(361) |
100.0(460) |
|
|
Mother's age when got married |
||||||||||
15-25 |
22.2(138) |
77.8(485) |
100.0(623) |
3.503 |
0.174 |
16.3(100) |
83.7(514) |
100..0(614) |
8.567 |
0.014 |
26-35 |
29.8(39) |
70.2(92) |
100.0(131) |
|
|
26.6(37) |
73.4(102) |
100.0(139) |
|
|
36 and above |
25.0(1) |
75.0(3) |
100.(94) |
|
|
33.3(1) |
66.7(2) |
100.0(3) |
|
|
Mother's age first baby |
||||||||||
15-25 |
22.8(133) |
77.2(451) |
100.0(584) |
0.662 |
0.718 |
16.5(96) |
83.5(486) |
100.0(582) |
6.064 |
0.048 |
26-35 |
24.9(43) |
75.1(130) |
100.0(173) |
|
|
23.9(42) |
76.1(134) |
100.0(176) |
|
|
36 and above |
33.3(2) |
66.7(4) |
100.0(6) |
|
|
0.0(0) |
100.0(5) |
100.0(5) |
|
|
Mother's age current baby |
||||||||||
15-25 |
22.4(57) |
77.6(198) |
100.0(255) |
0.208 |
0.901 |
19.3(50) |
80.7(209) |
100.0(259) |
9.297 |
0.01 |
26-35 |
23.9(91) |
76.1(290) |
100.0(381) |
|
|
20.1(80) |
79.9(318) |
100.0(398) |
|
|
36 and above |
23.6(30) |
76.4(97) |
100.0(127) |
|
|
7.5(8) |
92.5(98) |
100.0(106) |
|
|
Number of children given birth to |
||||||||||
1 ˗5 |
23.6(161) |
76.4(520) |
100.0(681) |
0.59 |
0.745 |
18.3(127) |
81.7(568) |
100.0(695) |
1.775 |
0.412 |
6˗10 |
21.0(17) |
79.0(64) |
100.0(81) |
|
|
15.2(10) |
84.8(56) |
100.0(66) |
|
|
11 and above |
0.0(0) |
100.0(1) |
100.0(1) |
|
|
50.0(1) |
50.0(1) |
100.0(2) |
|
|
Number of children under 5 years |
||||||||||
1 ˗2 |
23.0(172) |
77.0(576) |
100.0(748) |
|
18.0(135) |
82.0(613) |
100.0(748) |
0.038 |
0.846 |
|
3˗5 |
40.0(6) |
60.0(9) |
100.0(15) |
2.377 |
0.123 |
20.0(3) |
80.0(12) |
100.0(15) |
|
|
Birth interval with the previous birth |
||||||||||
1 ˗5 |
23.6(126) |
76.4(408) |
100.0(534) |
0.382 |
0.537 |
17.4(87) |
82.6(412) |
100.0(499) |
0.02 |
0.888 |
6˗10 |
20.7(19) |
79.3(73) |
100.0(92) |
|
|
18.1(15) |
81.9(68) |
100.0(83) |
|
|
Number of children alive today |
||||||||||
1 ˗5 |
23.5(164) |
76.5(535) |
100.0(699) |
0.345 |
0.838 |
18.1(128) |
81.9(579) |
100.0(707) |
0.221 |
0.895 |
6˗10 |
22.2(14) |
77.8(49) |
100.063) |
|
|
18.2(10) |
81.8(45) |
100.0(55) |
|
|
11 and above |
0.0(0) |
100.0(1) |
100.(91) |
|
|
0.0(0) |
100.0(1) |
100.0(1) |
|
|
Gender of the Head of household |
||||||||||
Female |
12.7(20) |
87.3(137) |
100.0(157) |
12.39 |
0 |
13.6(29) |
86.4(184) |
100.0(213) |
3.988 |
0.046 |
Male |
26.1(158) |
73.9(448) |
100.0(606) |
|
|
19.8(109) |
80.2(441) |
100.0(550) |
|
|
Occupation of the mother |
||||||||||
Farming/agriculture |
20.5(59) |
79.5(229) |
100.0(288) |
3.672 |
0.299 |
11.5(44) |
88.5(337) |
100.0(381) |
41.53 |
0 |
Self employed |
23.7(75) |
76.3(242) |
100.0(317) |
|
|
20.5(49) |
79.5(190) |
100.0(239) |
|
|
Salaried employed |
33.3(9) |
66.7(18) |
100.0(27) |
|
|
56.0(14) |
44.0(11) |
100.0(25) |
|
|
Unemployed |
26.7(35) |
73.3(96) |
100.0(131) |
|
|
26.3(31) |
73.7(87) |
100.0(118) |
|
|
Husband's education |
||||||||||
Illiterate |
6.3(5) |
93.8(75) |
100.0(80) |
23.731 |
0 |
5.4(5) |
94.6(87) |
100.0(92) |
76.675 |
0 |
Primary level |
20.7(75) |
79.3(287) |
100.0(362) |
|
|
12.2(58) |
87.8(419) |
100.0(477) |
|
|
Secondary level |
30.5(98) |
69.5(223) |
100.0(321) |
|
|
38.7(75) |
61.3(119) |
100.0(194) |
|
|
Occupation of the father |
||||||||||
Farming/agriculture |
17.5(29) |
82.5(137) |
100.0(166) |
17.64 |
0.001 |
9.3(26) |
90.7(253) |
100.0(279) |
84.53 |
0 |
Self employed |
22.4(90) |
77.6(312) |
100.(402) |
|
|
17.2(47) |
82.8(227) |
100.0(274) |
|
|
Salaried employed |
39.8(37) |
60.2(56) |
100.0(93) |
|
|
51.6(47) |
48.4(44) |
100.0(91) |
|
|
Unemployed |
21.6(22) |
78.4(80) |
100.0(102) |
|
|
15.1(18) |
84.9(101) |
100.0(119) |
|
|
Wealth index |
||||||||||
Category 1 |
15.9(10) |
84.1(53) |
100.0(63) |
3.43 |
0.18 |
7.9(7) |
92.1(82) |
100.0(89) |
9.994 |
0.007 |
Category 2 |
22.4(88) |
77.6(305) |
100.0(393) |
|
|
17.4(70) |
82.6(333) |
100.0(403) |
|
|
Category 3 |
26.1(80) |
73.9(227) |
100.0(307) |
|
|
22.5(61) |
77.5(210) |
100.0(271) |
|
|
Comprehensive knowledge on IYCF |
||||||||||
No |
23.3(172) |
76.7(567) |
100.0(739) |
0.039 |
0.844 |
17.4(119) |
82.6(563) |
100.0(682) |
1.764 |
0.184 |
Yes |
25.0(6) |
75.0(18) |
100.0(24) |
|
|
23.5(19) |
76.5(62) |
100.0(81) |
|
|
Intervention group |
Control group |
|||||||||||||||||
Variables |
Yes |
No |
Total |
Cor |
CI at 95% |
p value |
AOR |
CI at 95% |
p value |
Yes |
No |
Total |
Cor |
CI at 95% |
p value |
Aor |
CI at 95% |
p value |
Child’s sex |
|
|
|
|
|
|
|
|
|
|
|
|
|
|
|
|
|
|
Female |
27.2 |
72.8 |
100.0 |
1.5 |
1.105- |
0.011 |
1.6 |
1.134- |
0.0 |
|
|
|
|
|
|
|
|
|
(104) |
(278) |
(382) |
52 |
2.179 |
27 |
2.334 |
08 |
|||||||||||
Male |
19.4 |
80.6 |
100.0 |
1 |
|
|
1 |
|
|
|
|
|
|
|
|
|
|
|
(74) |
(307) |
(381) |
||||||||||||||||
Child's |
|
|
|
|
|
|
|
|
|
|
|
|
|
|
|
|
|
|
41-45 |
30.2 |
69.8 |
100.0 |
3.4 |
1.887- |
0.000 |
3.58 |
1.921- |
0.0 |
19.4 |
80.6 |
100.0 |
1.4 |
0.935- |
0.1 |
1.1 |
0.719- |
0.5 |
|
(80) |
(185) |
(265) |
31 |
6.236 |
|
|
6.670 |
00 |
(56) |
(232) |
(288) |
12 |
2.132 |
01 |
39 |
1.804 |
80 |
46-50 |
22.8 |
77.2 |
100.0 |
2.3 |
1.299- |
0.005 |
2.5 |
1.361- |
0.0 |
14.6 |
85.4 |
100.0 |
1 |
|
|
1 |
|
|
|
(83) |
(281) |
(364) |
43 |
4.228 |
|
14 |
4.644 |
03 |
(53) |
(310) |
(363) |
|
|
|
|
|
|
|
|
|
|
|
|
|
|
|
|
|
|
|
|
|
|
|
|
|
51-53 |
11.2 |
88.8 |
100.0 |
1 |
|
|
1 |
|
|
29.9 |
74.1 |
100.0 |
2.0 |
1.223 |
0.0 |
1.7 |
0.957- |
0.0 |
|
(15) |
(119) |
(134) |
|
|
|
|
|
|
(29) |
(83) |
(112) |
44 |
3.415 |
06 |
22 |
3.100 |
70 |
Age of the |
|
|
|
|
|
|
|
|
|
|
|
|
|
|
|
|
|
|
18-25 |
|
|
|
|
|
|
|
|
|
11.3 |
88.7 |
100.0 |
1 |
|
|
1 |
|
|
|
|
|
|
|
|
|
|
|
|
(12) |
(94) |
(106) |
|
|
|
|
|
|
26-35 |
|
|
|
|
|
|
|
|
|
21.9 |
78.1 |
100.0 |
2.1 |
1.151- |
0.0 |
1.6 |
0.766- |
0.1 |
|
|
|
|
|
|
|
|
|
|
(92) |
(329) |
(421) |
90 |
4.170 |
17 |
84 |
3.704 |
95 |
|
|
|
|
|
|
|
|
|
|
|
|
|
|
|
|
|
|
|
36 and |
|
|
|
|
|
|
|
|
|
14.4 |
85.6 |
100. |
1.3 |
0.653 |
0.4 |
1.8 |
0.695- |
0.2 |
above |
|
|
|
|
|
|
|
|
|
(34) |
(202) |
0(236) |
18 |
2.661 |
40 |
84 |
5.107 |
13 |
Marital status |
|
|
|
|
|
|
|
|
|
|
|
|
|
|
|
|
|
|
Married and |
|
|
|
|
|
|
|
|
|
20.3 |
79.7 |
100.0 |
2.1 |
1.256- |
0.0 |
2.3 |
1.060- |
0.0 |
cohabitation |
|
|
|
|
|
|
|
|
|
(118) |
(463) |
(581) |
06 |
3.532 |
05 |
87 |
5.372 |
36 |
Single/ |
|
|
|
|
|
|
|
|
|
10.8 |
89.2 |
100.0 |
1 |
|
|
1 |
|
|
|
|
|
|
|
|
|
|
|
|
|
|
|
|
|
|
|
|
|
Others |
|
|
|
|
|
|
|
|
|
16.7 |
83.3 |
100.0 |
1.6 |
0.183- |
0.6 |
1.7 |
0.140- |
0.6 |
|
|
|
|
|
|
|
|
|
|
(1) |
(5) |
(6) |
53 |
14.903 |
54 |
45 |
21.733 |
65 |
Mother's |
|
|
|
|
|
|
|
|
|
|
|
|
|
|
|
|
|
|
Illiterate |
11. |
88.7 |
100.0 |
1 |
|
|
1 |
|
|
7.2 |
92.8 |
100.0 |
1 |
|
|
1 |
|
|
Primary level |
18.0 |
82.0 |
100.0 |
1.7 |
0.707- |
0.233 |
1.4 |
0.559- |
0.4 |
11.2 |
88.8 |
100.0 |
1.6 |
0.620- |
0.3 |
1.3 |
0.481- |
0.5 |
|
(71) |
(324) |
(395) |
17 |
4.170 |
|
22 |
3.618 |
59 |
(51) |
(405) |
(456) |
12 |
4.191 |
28 |
33 |
3.697 |
80 |
Secondary |
|
|
|
|
|
|
|
|
|
|
|
|
|
|
|
|
|
|
|
32.1 |
67.9 |
100.0 |
3.6 |
1.530- |
0.004 |
2.4 |
0.952- |
0.0 |
34.5 |
65.5 |
100.0 |
6.7 |
2.606- |
0.0 |
2.3 |
0.813- |
0.1 |
above |
(101) |
(214) |
(315) |
97 |
8.931 |
|
73 |
6.422 |
63 |
(82) |
(156) |
(238) |
28 |
17.372 |
00 |
89 |
7.014 |
13 |
Place of the residence of the mother |
||||||||||||||||||
Rural |
17.5 |
82.5 |
100.0 |
1 |
|
|
1 |
|
|
12.9 |
87.1 |
100.0 |
1 |
|
|
1 |
|
|
|
(54) |
(255) |
(309) |
|
|
|
|
|
|
(39) |
(264) |
(303) |
|
|
|
|
|
|
Urban |
27.3 |
72.7 |
100.0 |
1.7 |
1.239- |
0.002 |
1.4 |
0.885- |
0.1 |
21.5 |
78.5 |
100.0 |
1.8 |
1.241- |
0.0 |
0.5 |
0.293- |
0.0 |
|
(124) |
(330) |
(454) |
74 |
2.541 |
|
15 |
2.262 |
47 |
(99) |
(361) |
(460) |
56 |
2.778 |
03 |
66 |
1.093 |
90 |
Mother's age |
|
|
|
|
|
|
|
|
|
|
|
|
|
|
|
|
|
|
15-25 |
|
|
|
|
|
|
|
|
|
16.3 (100) |
83.7 |
100.0 |
1 |
|
|
1 |
|
|
26-35 |
|
|
|
|
|
|
|
|
|
26.6 (37) |
73.4 |
100.0 |
1.8 |
1.209- |
0.0 |
1.3 |
|
0.5 |
36 and above |
|
|
|
|
|
|
|
|
|
33.3 (1) |
66.7 |
100.0 |
2.5 |
0.231- |
0.4 |
- |
|
0.9 |
Mother's age |
|
|
|
|
|
|
|
|
|
|
|
|
|
|
|
|
|
|
15-25 |
|
|
|
|
|
|
|
|
|
16.5 |
83.5 |
100.0 |
1 |
|
|
1 |
|
|
26-35 |
|
|
|
|
|
|
|
|
|
23.9 |
76.1 |
100.0 |
1.5 |
1.053- |
0.0 |
0.6 |
0.267- |
0.4 |
36 and above |
|
|
|
|
|
|
|
|
|
0.0(0) |
100. |
100. |
0.0 |
0.000- |
0.9 |
0.0 |
0.000- |
0.9 |
Mother's age current baby |
||||||||||||||||||
15-25 |
|
|
|
|
|
|
|
|
|
19.3 |
80.7 |
100.0 |
2.9 |
1.338- |
0.0 |
2.3 |
0.816- |
0.1 |
26-35 |
|
|
|
|
|
|
|
|
|
20.1 |
79.9 |
100.0 |
3.0 |
1.439- |
0.0 |
1.8 |
0.741- |
0.1 |
36 and above |
|
|
|
|
|
|
|
|
|
7.5(8) |
92.5 |
100.0 |
1 |
|
|
1 |
|
|
Gender of the Head of household |
||||||||||||||||||
Female |
12.7 |
87.3 |
100.0 |
1 |
|
|
1 |
|
|
13.6 |
86.4 |
100.0 |
1 |
|
|
1 |
|
|
Male |
26.1 |
73.9 |
100.0 |
2.4 |
1.46 |
0.0 |
2.6 |
1.534 |
0.0 |
19.8 |
80.2 |
100.0 |
1.5 |
1.006- |
0.0 |
0.7 |
0.378- |
0.3 |
Occupation of the mother |
||||||||||||||||||
Farming/ |
|
|
|
|
|
|
|
|
|
11.5 |
88.5 |
100. |
1 |
|
|
1 |
|
|
Self employed |
|
|
|
|
|
|
|
|
|
20.5 |
79.5 |
100.0 |
1.9 |
1.267- |
0.0 |
1.5 |
0.764- |
0.2 |
Salaried employed |
|
|
|
|
|
|
|
|
|
56.0 |
44.0 |
100.0 |
9.7 |
4.167- |
0.0 |
2.3 |
0.820- |
0.1 |
Unemployed |
|
|
|
|
|
|
|
|
|
26.3 |
73.7 |
100.0 |
2.7 |
1.628- |
0.0 |
1.9 |
0.953- |
0.0 |
Husband's |
|
|
|
|
|
|
|
|
|
|
|
|
|
|
|
|
|
|
Illiterate |
6.3 |
93.8 |
100. |
1 |
|
|
1 |
|
|
5.4(5) |
94.6 |
100.0 |
1 |
|
|
1 |
|
|
Primary level |
20.7 |
79.3 |
100.0 |
|
1.531- |
0.0 |
3. |
1.411 |
0.0 |
12.2 |
87.8 (419) |
100.0 |
2.4 |
0.939- |
0.0 |
2.0 |
0.780- |
0.1 |
Secondary level |
30.5 |
69.5 |
100.0 |
6.5 |
2.586- |
0.0 00 |
4.1 |
1.554- |
0.0 |
38.7 |
61.3 |
100.0 |
10.9 |
4.256- |
0.0 |
3.9 |
1.379- |
0.0 |
Occupation of the father |
||||||||||||||||||
Farming/ agriculture |
17.5 |
82.5 |
100.0 |
1 |
|
|
1 |
|
|
9.3 |
90.7 |
100.0 |
1 |
|
|
1 |
|
|
Self employed |
22.4 |
77.6 |
100. |
1.3 |
0.857- |
0.1 91 |
0.7 |
0.437 -1.454 |
0.4 |
17.2 |
82.8 |
100.0 |
2.0 |
1.208- |
0.0 |
1.35 |
0.614- |
0.4 |
Salaried employed |
39.8 |
60.2 |
100. |
3.1 |
1.753- |
0.0 |
1.5 |
0.766- |
0.2 |
51.6 |
48.4 |
100. |
10.3 |
5.842- |
0.0 |
3.5 |
1.487- |
0.0 |
Unemployed |
21.6 |
78.4 |
100.0 |
1.2 |
0.700- |
0.4 |
1.1 |
0.528 |
0.7 |
15.1 |
84.9 |
100.0 |
1.7 |
0.911- |
0.0 |
1.9 |
0.797- |
0.1 |
Wealth index |
|
|
|
|
|
|
|
|
|
|
|
|
|
|
|
|
|
|
Category 1 |
|
|
|
|
|
|
|
|
|
7.9(7) |
92.1 |
100. |
1 |
|
|
1 |
|
|
Category 2 |
|
|
|
|
|
|
|
|
|
17.4 |
82.6 |
100.0 |
2.4 |
1.091- |
0.0 |
1.6 |
0.739- |
0.2 |
Category 3 |
|
|
|
|
|
|
|
|
|
22.5 |
77.5 (210) |
100.0 |
3.4 |
1.495- |
0.0 |
1.8 |
0.739- |
0.1 |
Characteristics |
Intervention group (n=763) |
Control group (n=763) |
Total (n=1526) |
|
|
|
%(n) |
%(n) |
%(n) |
χ2 |
p value |
Piped, bottled, and public tap/standpipe as main of drinking water |
|||||
Yes |
81.65(623) |
61.73(471) |
71.69(1094) |
74.601 |
< 0 .001 |
No |
18.35(140) |
38.27(292) |
28.31(432) |
|
|
Time to get water from the source less than 30 minutes |
|||||
Yes |
89.65 (684) |
77.85 (594) |
83.75 (1278) |
38.999 |
< 0.001 |
No |
10.35 (79) |
22.15 (169) |
16.25 (248) |
|
|
Making water safe to drink by boiling water, using chemical products , Jibu , filter , water in bottles |
|||||
Yes |
61.47 (469) |
50.46 (385) |
55.96 (854) |
18.762 |
< 0 .001 |
No |
38.53 (294) |
49.54 (378) |
44.04 (672) |
|
|
Storage of drinking water |
|||||
Yes |
62.25 (475) |
58.98 (450) |
60.62 (925) |
1.715 |
0.191 |
No |
37.75 (288) |
41.02 (313) |
39.38 (601) |
|
|
Hand washing station within 5 meters from the toilet |
|||||
Yes |
38.01 (290) |
53.34 (407) |
45.67 (697) |
36.152 |
< 0 .001 |
No |
61.99 (473) |
46.66 (356) |
54.33 (829) |
|
|
Hand washing station with Spigot or bucket with spigot |
|||||
Yes |
55.17 (160) |
45.70 (186) |
49.64 (346) |
6.077 |
0.013 |
No |
44.83 (130) |
54.30 (221) |
50.36 (351) |
|
|
Soap available at the place of handwashing near the toilet |
|
|
|
||
Yes |
35.26 (269) |
33.81 (258) |
34.53 (527) |
0.351 |
0.554 |
No |
64.74 (494) |
66.19 (505) |
65.47 (999) |
|
|
Washing hands at 5 critical moments |
|||||
Yes |
8.00 (61) |
10.48 (80) |
9.24 (141) |
2.821 |
0.093 |
No |
92.00 (702) |
89.52 (683) |
90.76 (1385) |
|
|
Disposal facility near the house |
|||||
Yes |
82.70 (631) |
77.33 (590) |
80.01 (1221) |
6.888 |
0.008 |
No |
17.30 (132) |
22.67 (173) |
19.99 (305) |
|
|
Use of Flush toilet or pit latrine as toilet |
|||||
Yes |
98.03 (748) |
97.90 (747) |
97.97 (1495) |
0.033 |
0.856 |
No |
1.97 (15) |
2.10 (16) |
2.03 (31) |
|
|
Distribution of Vit A |
|||||
Yes |
98.43 (751) |
99.48 (759) |
98.95 (1510) |
4.042 |
0.044 |
No |
1.57 (12) |
0.52 (4) |
1.05 (16) |
|
|
Drug for intestinal worms |
|||||
Yes |
97.77 (746) |
99.08 (756) |
98.43(1502) |
4.233 |
0.039 |
No |
2.23 (17) |
0.92 (7) |
1.57 (24) |
|
|
Distribution of micronutrients |
|||||
Yes |
89.65 (684) |
83.62 (638) |
86.63 (1322) |
11.973 |
< 0 .001 |
No |
10.35 (79) |
16.38 (125) |
13.37 (204) |
|
|
Supplementation preventive zinc |
|||||
Yes |
62.52 (477) |
35.52 (271) |
49.02 (748) |
111.278 |
< 0 .001 |
No |
37.48 (286) |
64.48 (492) |
50.98 (778) |
|
|
Iron distribution |
|
|
|
|
|
Yes |
63.96 (488) |
27.92 (213) |
45.94 (701) |
199.548 |
< 0.001 |
No |
36.04 (275) |
72.08 (550) |
54.06 (825) |
|
|
Malaria prevention |
|||||
Yes |
43.38 (331) |
20.31 (155) |
31.85 (486) |
93.521 |
< 0 .001 |
No |
56.62 (432) |
79.69 (608) |
68.15 (1040) |
|
|
Vaccination |
|
|
|
|
|
Yes |
98.43 (751) |
98.82 (754) |
98.62 (1505) |
0.434 |
0.509 |
No |
1.57 (12) |
1.18 (9) |
1.38 (21) |
|
|
Diarrhea |
|
|
|
|
|
Yes |
63.70 (486) |
65.53 (500) |
64.61 (986) |
0.562 |
0.453 |
No |
36.30 (277) |
34.47 (263) |
35.39 (540) |
|
|
Continuing breastfeeding if diarrhea |
|||||
Yes |
94.65 (460) |
93.20 (466) |
93.91 (926) |
0.906 |
0.341 |
No |
5.35 (26) |
6.80 (34) |
6.09 (60) |
|
|
Nutritional counselling available |
|||||
Yes |
93.18 (711) |
72.48 (553) |
82.83 (1264) |
115.032 |
< 0.001 |
No |
6.82 (52) |
27.52 (210) |
17.17 (262) |
|
|
Kitchen garden available |
|
|
|
|
|
Yes |
38.01 (290) |
45.09 (344) |
41.55 (634) |
7.868 |
0.005 |
No |
61.99 (473) |
54.91 (419) |
58.45 (892) |
|
|


