 |
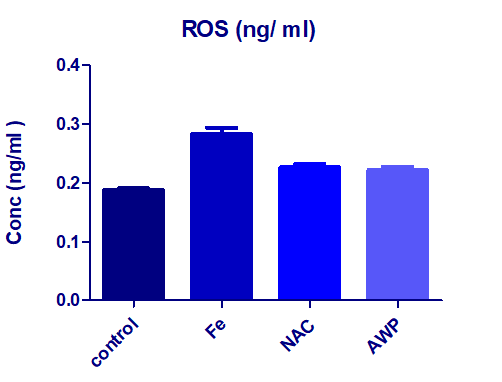
| Figure 1: Effects of NAC and AWP (G2 and G3) on the hepatic tissue ROS concentration presented as mean ± S.D. ++P< 0.05 compared to iron overloaded group G1 (Fe) deduced by one away ANOVA (+++ significant when compared to healthy control group G0). |
|
| Figure 1: Effects of NAC and AWP (G2 and G3) on the hepatic tissue ROS concentration presented as mean ± S.D. ++P< 0.05 compared to iron overloaded group G1 (Fe) deduced by one away ANOVA (+++ significant when compared to healthy control group G0). |
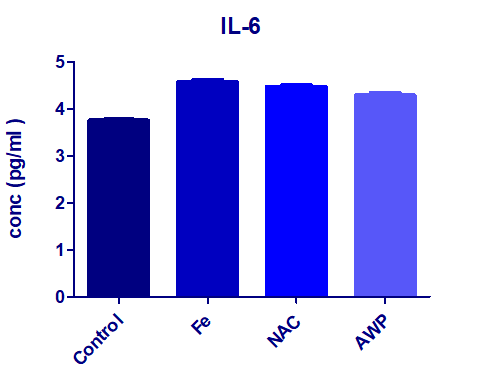 |
| Figure 2: : Effect of iron overloading on the pro-inflammatory response marker IL-6 presented as mean ± S.D., showed significant increase (++P< 0.01) compared the level of healthy normal control group G0. In presence of NAC or AWP (G2 or G3) as prophylacting agents did not show considerable change when compared to the non trated group G1. |
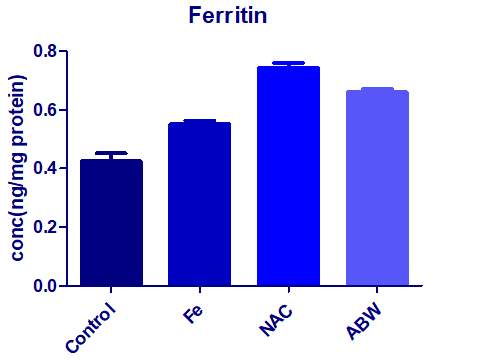 |
| Figure 3: Effect of iron overloading (G1) on the hepatic ferritin concentration as mean ± S.D. (+++P< 0.01), comparing to the normal control G0. The associated treatment with NAC (G2) or with the supplemented AWP (G3). |
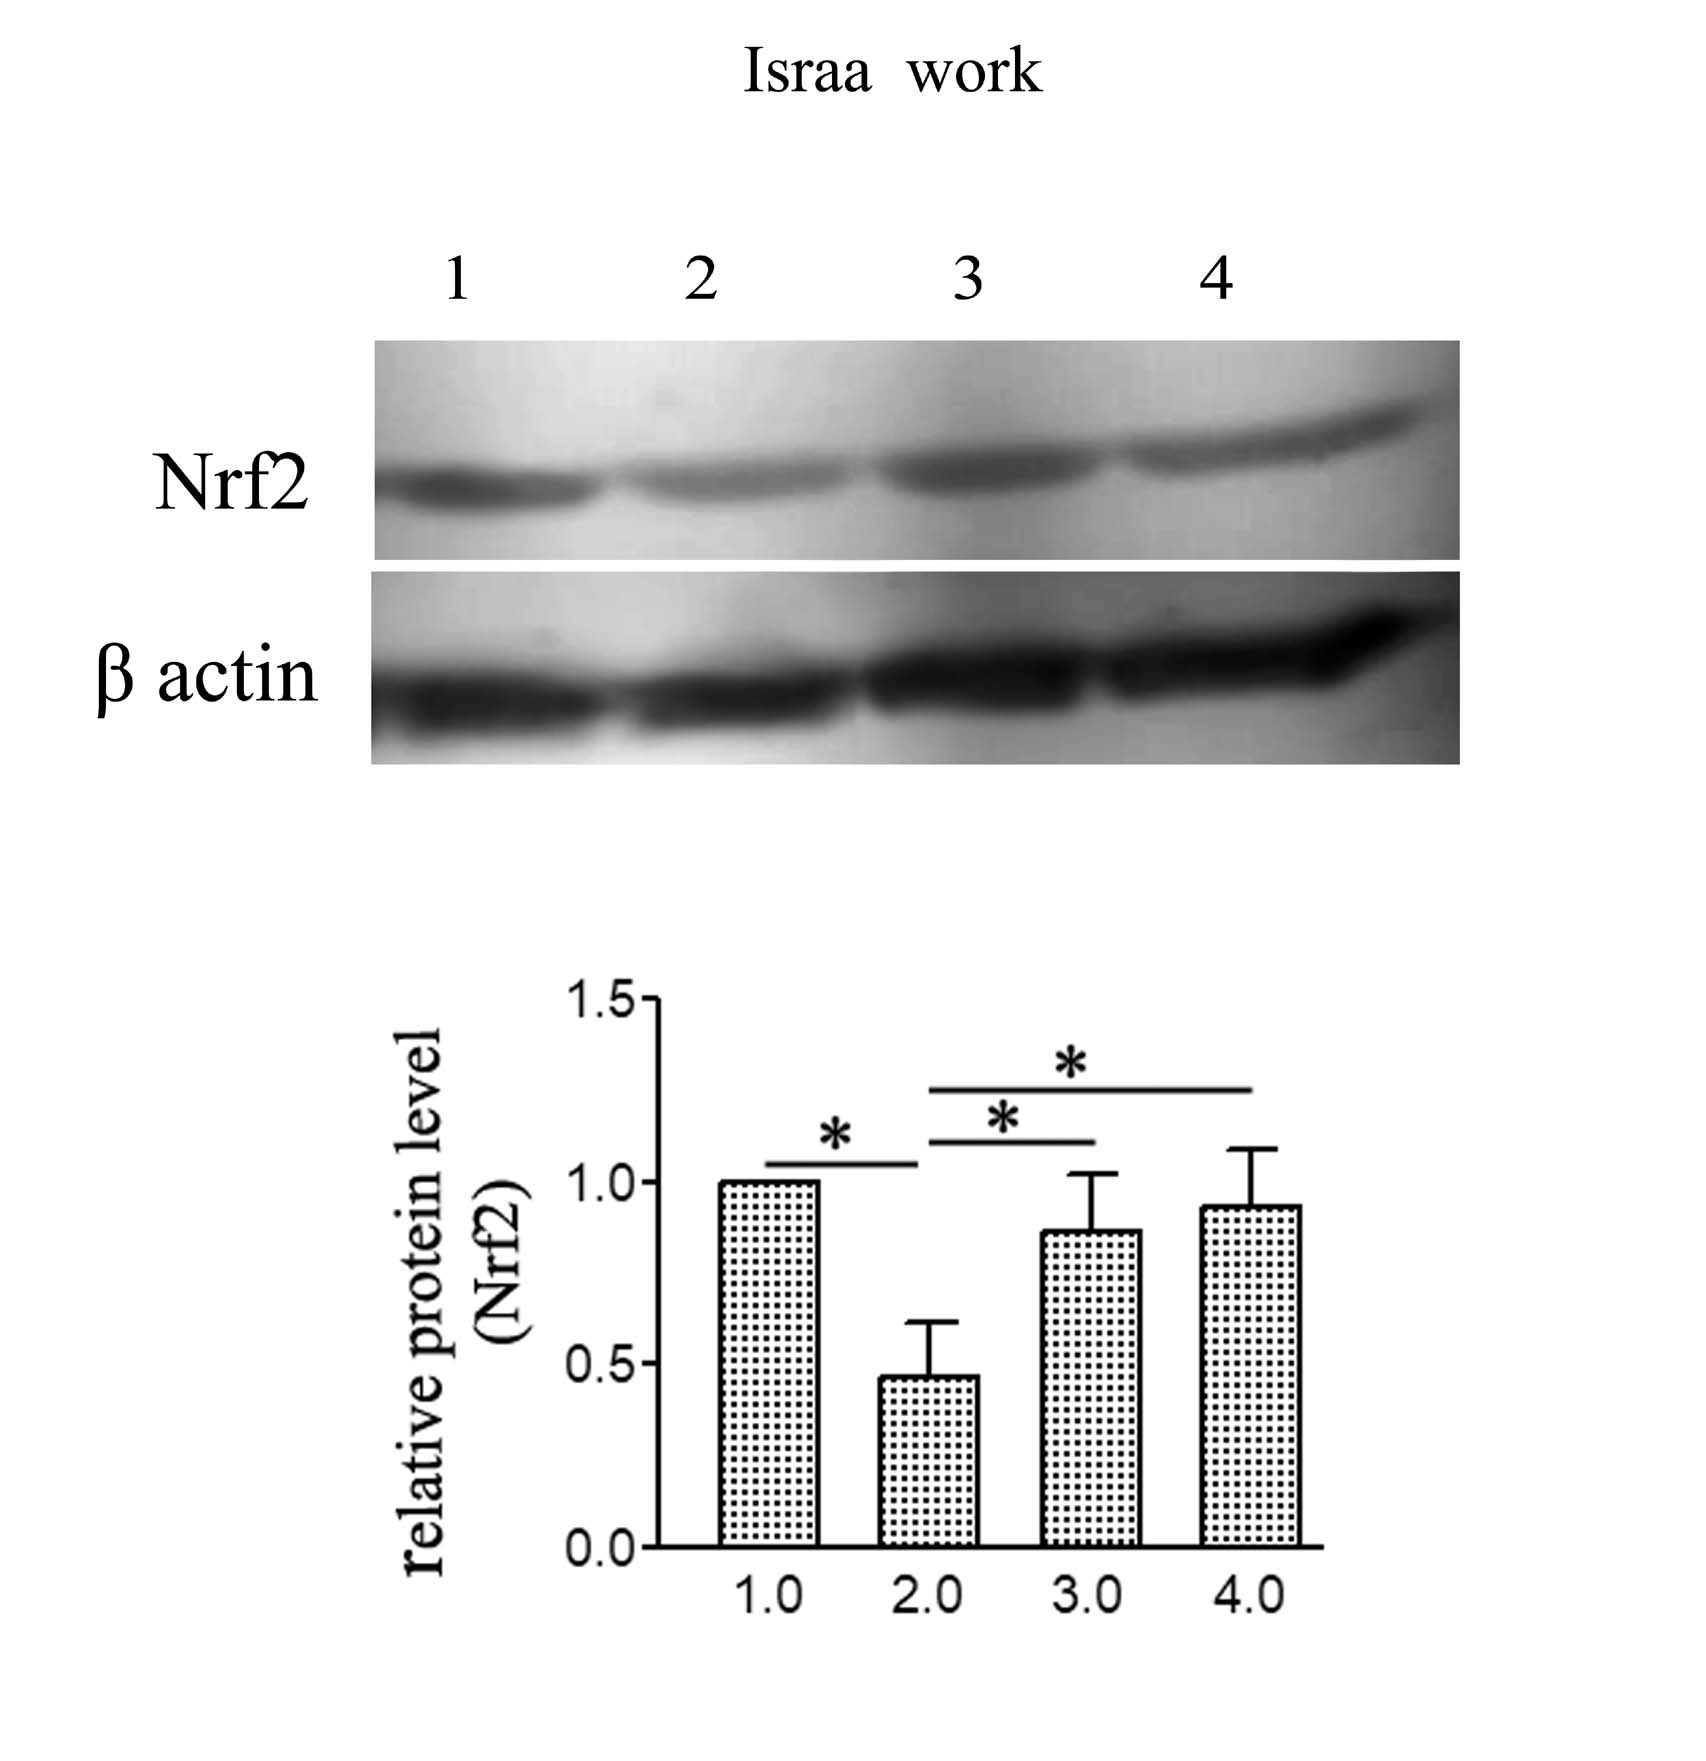 |
| Figure 4: Impact of NAC or AWP prophylacting agents on the protein bands detected with ECL in the iron overloaded rats. The presented values; mean ± S.D. (+P< 0.01) compared to iron intoxicated group (G1), while statistical analysis and comparisons by using one-way ANOVA. |
 |
| Figure 5: Sections in rat liver stained by Prussian blue for demonstration of iron showing; (A) Healthy control group showing no deposition of iron(arrow) .( B) Iron overload intoxicated group showing high population of sinusoidal Von kupffer cells over loaded with iron( arrows) .(C) N-acetyl Cysteine treated intoxicated group showing some decrease in iron loaded Kupffer cells (arrows) . (D) Whey- Acetylated peptide treated intoxicated showing evident decrease of iron - loaded Kupffer cells ( arrows) .X400 |
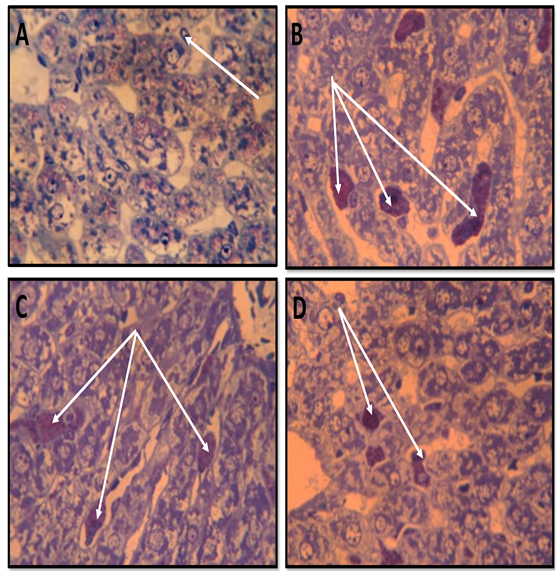 |
| Figure 6: Semithin sections in rat liver stained by Toluidine blue showing ; ( A) healthy control group with hepatocytes having normal active nuclei ( thin black arrows) and blood sinusoids lined by normal squamous cells and Kupffer cells free of any iron deposition( whit arrow). (.B) Iron overload intoxicated group showing numerous iron loaded Kupffer cells (white arrows). (C)&(D) N-acetyl Cysteine and WheyAcetylated peptide treated groups showing that the iron loaded cells (white arrows) appeared more or less similar to the intoxicated group with normal hepatocyte . X1000 |
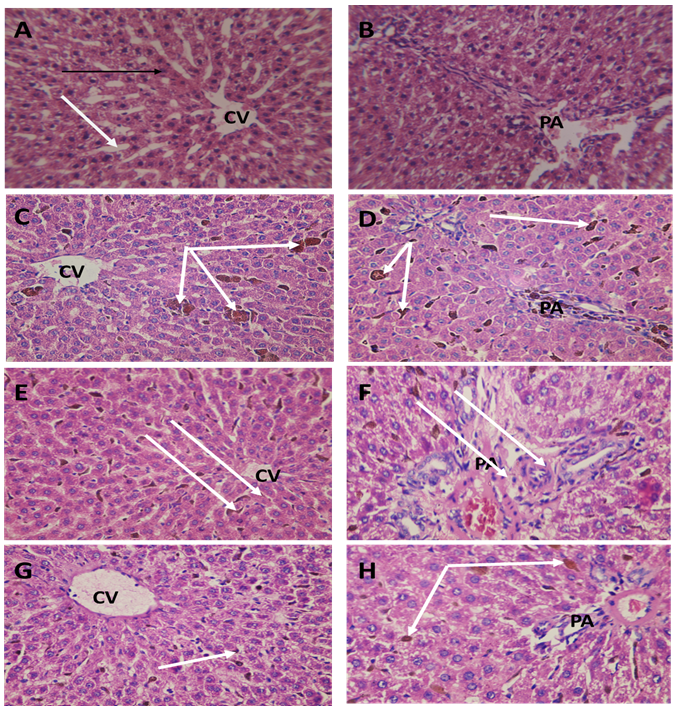 |
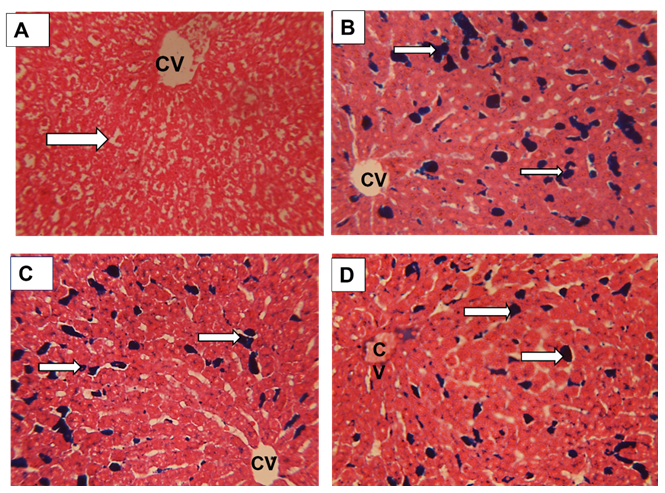
| Figure 7: Sections in the rat liver from rat central vein(CV) and portal area(PA) regions stained with HX&E stain to show:. (A&B) Healthy control group G0 showing the normal structure of the liver with thin walled blood sinusoids (white arrow) and normal hepatocytes cell cords, ( C&D) Iron overload intoxicated group G1 showing the Kupffer cells of the blood sinusoids appeared engorged with iron( white arrow) . (E&F) N-acetyl Cysteine treated intoxicated group G2 showing the Kupffer cells of the blood sinusoids appeared engorged with iron but lesser than the iron overload group. (.G&H) Whey- Acetylated peptide treated intoxicated group G3 showing the Kupffer cells of the blood sinusoids appeared engorged with iron (white arrow) but lesser than the iron overload and N-Acetyl Cysteine treated groups. X400 |
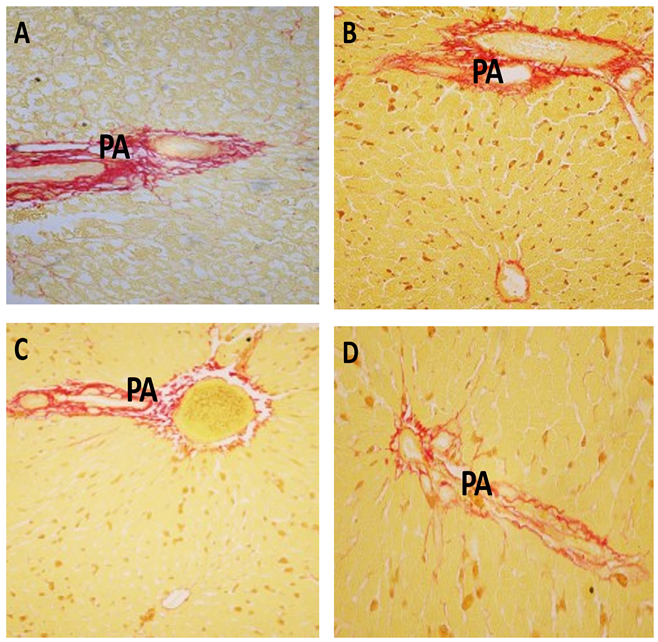 |
| Figure 8: Sections from rat liver portal area(PA) stained by Van Gieson stain ( red color) for collagen to show :(A) Healthy control group showing normal collagen content in the portal area (PA) . (B) Iron overload intoxicated group showing an increase in collagen deposition in the portal area(PA) . (C) N-acetyl Cysteine treated intoxicated group showing moderate decrease in collagen content. (D) Whey- Acetylated peptide treated intoxicated showing marked decrease of collagen content. (X400) |
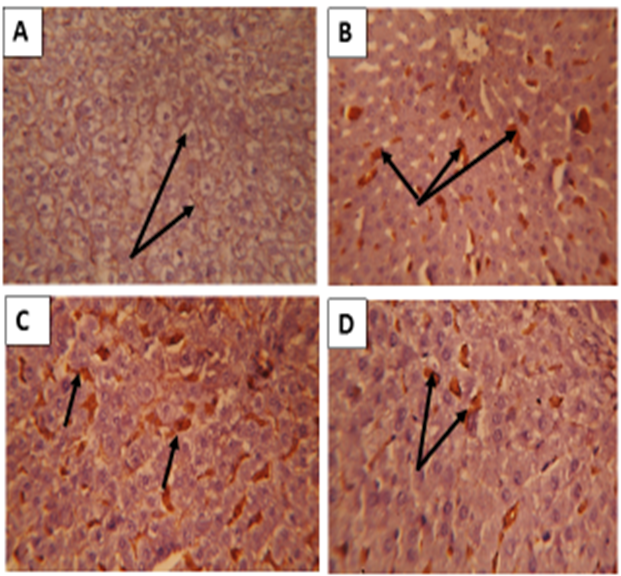 |
| Figure 9: : Sections in the liver of rats immunostained with CD 68 ( phagocytic Kupffer cells) showing ;(A)Healthy G0 Control group showed negative or few CD68 positive cells ( arrows). (B) Iron intoxicated group: showing numerous large sized CD68 immuno-positive cells ( arrows).(C) NAC treated group (G2): showed less smaller sized Cd68 positive cells. (D)Acetylated whey treated group (G3): showing evident decrease in size and number of Cd68 positive cells. (CD68 immunostaining X400) |
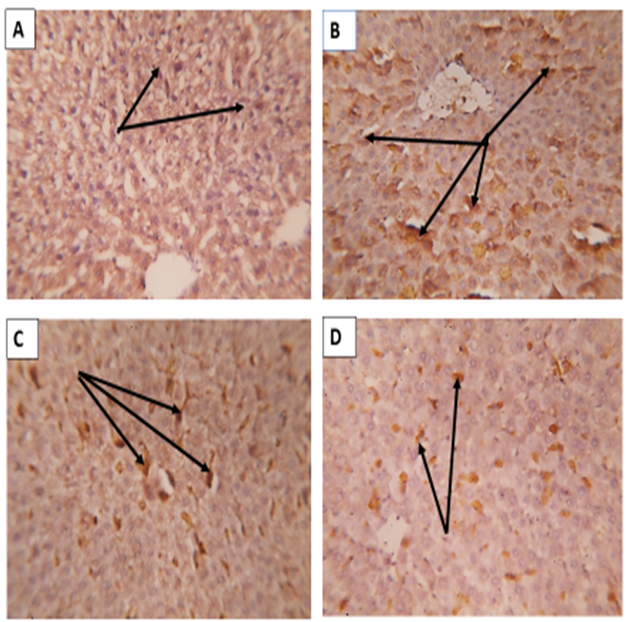 |
| Figure 10: Sections in rat liver immunostained by CD163; A) Healthy G0 control group showed merely negative reaction. B) Iron over load intoxicated group G1 showing intense positive reaction (arrows). C) NAC treated G2 group showed a decrease in the positive reaction than the only iron intoxicated G1 (arrows). D) ABW treated group G3 showing a decrease in the intensity of the positive distribution reaction than the previous G2 treated group (arrows). (X400) |
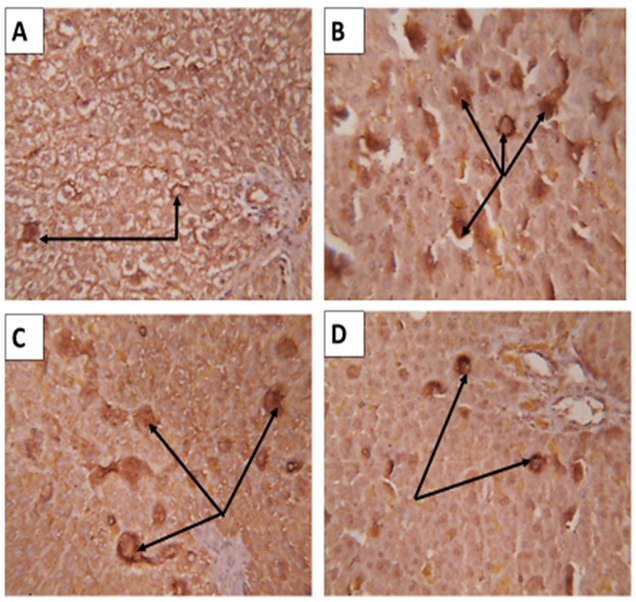 |
| Figure 11: Sections from rat liver immuno-stained for Caspase- 3 immuno-expressions showing ; (A) Healthy control group (G0) showing faint defuse staining in some hepatocytes ( arrows). (B) Iron over load intoxicated (G1) group showing an increase in hepatocytes with intensive positive caspase-3 immuno-expression.( arrows). (C) The NAC treated intoxicated (G2) group showing mild decrease in the intensity of positively stained hepatocytes (arrows) than that of G1 group. (D) The acetylated whey (ABW) treated during iron intoxicated group (G3) showed marked decrease in the intensity and number of the positively stained hepatocytes (arrows) than those of the previous G2 treated group. (X400) |
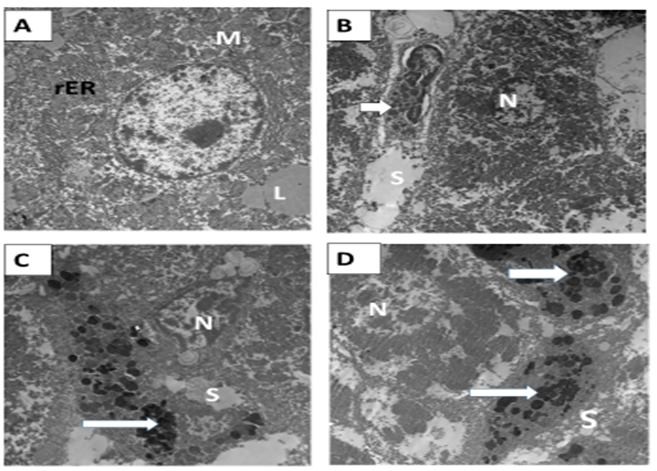 |
| Figure 12: Electron micrograph in rat liver A&B) Healthy control G0 group showing; normal hepatocyte with euchromatic nucleus (N). The cytoplasm contained well developed RER (rER) and mitochondria (M). Lipid droplets (L) Von Kupffer cell (arrow) were seen lining the blood sinusoids (S). C&D) Ferrous intoxicated G1 group showing; the nucleus (N) of hepatocyte appeared irregular, heterochromatic, and surrounded by many vacuoles. Numerous mitochondria (M) were observed amalgamated with each other with ill-defined cristae and electron-dense matrix. The Von Kupffer cell was engorged with numerous and irregular secondary lysosomes (arrows). (X4800, 3600 ,4800 and 3600) . |
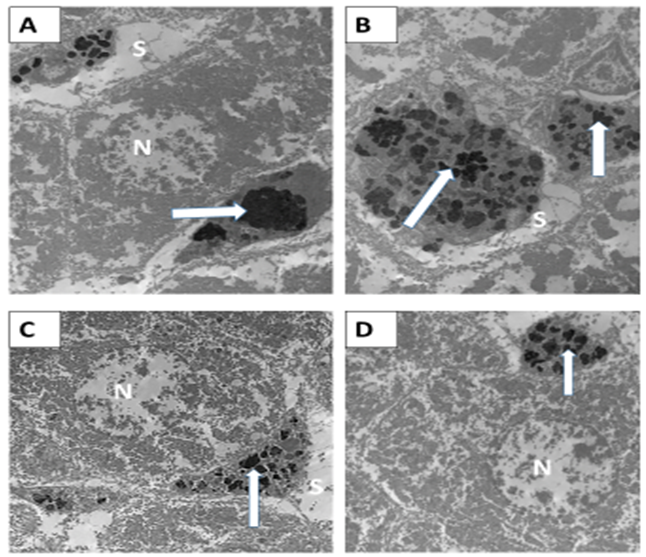 |
| Figure 13: (A&B) N-acetyl Cysteine Iron treated group (G2) showing; the Von Kupffer cells appeared still engorged with secondary lysosomes (arrows) similar to some extent to the iron intoxicated group. The mitochondria (M) still appeared smaller in size and amalgamated with each other. (C&D) Acetylated peptide and Iron treated group (G3) showing; the Von Kupffer cells (arrows) appeared smaller in size and not engorged with secondary lysosomes compared to the previous treated groups. The mitochondria(M) appeared separated from each other with ill-defined cristae. (X3600). |