 |
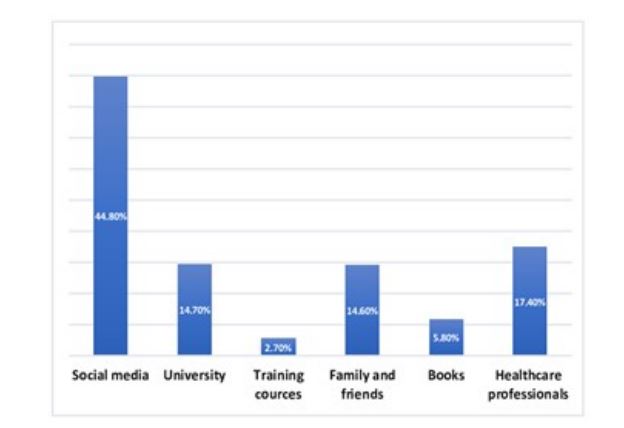
| Figure 1: Nutrition information sources among college students |
|
| Figure 1: Nutrition information sources among college students |
Variables |
f |
% |
|
Gender |
Females |
492 |
73.0% |
Males |
183 |
27.0% |
|
Age range |
17 - 21 |
442 |
65.5% |
22 - 43 |
233 |
34.5% |
|
Class |
Freshmen |
98 |
14.5% |
Sophomore |
153 |
22.6% |
|
Junior |
186 |
27.6% |
|
Senior |
220 |
32.6% |
|
Higher Education |
18 |
2.7% |
|
Faculty |
Petroleum and Engineering |
30 |
4.4% |
Medicine |
150 |
22.2% |
|
Science |
146 |
21.6% |
|
Life Sciences |
137 |
20.3% |
|
Business Administration |
93 |
13.9% |
|
Art |
119 |
17.6% |
|
Weight Category |
Underweight |
37 |
5.5% |
Normal |
359 |
53.1% |
|
Overweight |
188 |
27.9% |
|
Obese |
91 |
13.5% |
|
I buy food from the dining facility (cafeteria, coffee shops, machines, etc.): |
f |
% |
Daily |
258 |
38.2% |
1-2 times/week |
209 |
31% |
3-4 times/week |
152 |
22.5% |
Never |
56 |
8.3% |
In college, I prefer eating: |
f |
% |
Sandwiches |
418 |
62% |
Healthy snacks (e.g. fruits/ vegetables) |
76 |
11.2% |
Snacks (chips, chocolate, etc.) |
37 |
5.5% |
Pasta/rice (contains chicken, meat, or egg) |
73 |
10.8% |
Fried foods |
40 |
5.9% |
Pastries |
31 |
4.6% |
I eat fruits and vegetables: |
f |
% |
1-2 times/week |
272 |
40.3% |
3-5 times/week |
96 |
14.22% |
Rarely |
232 |
34.4% |
Never |
75 |
11.11% |