 |
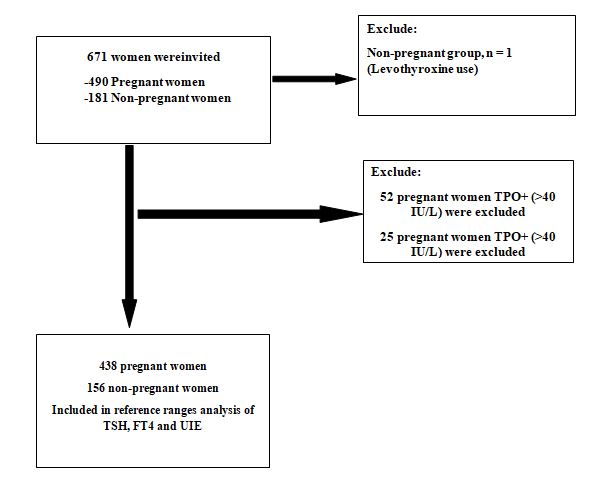
| Figure 1: Flow chart of the study design. Exclusion and inclusion criteria for pregnant women and non-pregnant women |
|
| Figure 1: Flow chart of the study design. Exclusion and inclusion criteria for pregnant women and non-pregnant women |
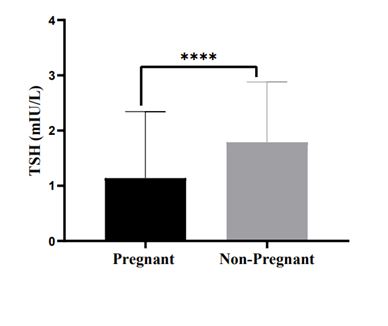 |
| Figure 2a: comparing the levels of TSH, TPO-Ab and MUIC in pregnant and non-pregnant women |
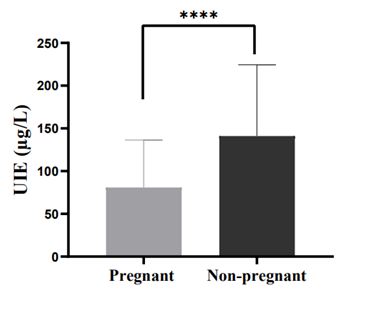 |
| Figure 2b: comparing the levels of TSH, TPO-Ab and MUIC in pregnant and non-pregnant women |
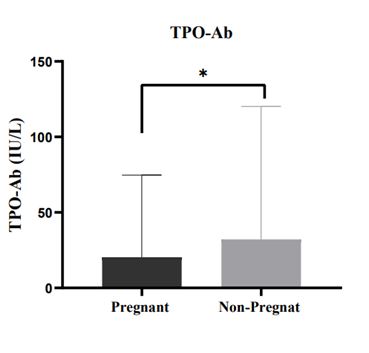 |
| Figure 2c: comparing the levels of TSH, TPO-Ab and MUIC in pregnant and non-pregnant women |
|
Pregnant women (1st) |
Non-pregnant women |
P-Value |
Age |
25.4±5.1 |
24.9±6.7 |
0.458 |
BMI |
24.9±4.1 |
20.9±3.8 |
---- |
Gestational Age |
9.0±2.0 |
---- |
----- |
Iodinated Salt |
20±5 |
20±4 |
NS |
TSH (mIU/L) |
0.80 |
1.7 |
0.001 |
Age<25 years |
0.9 |
1.8 |
----- |
Age 25 – 29.99 years |
1.0 |
1.4 |
---- |
Age 30 – 34.99 years |
0.70 |
1.25 |
--- |
Age >35 years |
0.75 |
1.25 |
---- |
5th percentile of TSH |
0.05 |
0.6 |
---- |
50th percentile of TSH |
0.85 |
1.6 |
|
95th percentile of TSH |
2.8 |
3.95 |
---- |
FT4 (pmol/L) |
14.6 |
13.5 |
0.009 |
5th percentile of FT4 |
9.1 |
9.1 |
---- |
50th percentile of FT4 |
14.2 |
14.5 |
|
95th percentile of FT4 |
21.9 |
19.5 |
----- |
UIE (µg/L) |
74 |
144 |
0.001 |
Urine Cr (mg/dL) |
1.47 |
1.34 |
0.01 |
UIC/Cr ratio (µg/mg) |
47 |
134 |
0.001 |
TPO-Ab (IU/L) |
2.6 |
3.3 |
0.03 |
Variable |
Pregnant women |
Non-Pregnant women |
||
|
Iodine deficient |
Iodine sufficient |
Iodine deficient |
Iodine sufficient |
TSH* |
|
|
|
|
Median |
0.9 |
0.8 |
1.90 |
1.7 |
P5 – P95 |
0.05 – 2.8 |
0.1 – 3.3 |
0.49 – 5.1 |
0.6 – 4.1 |
fT4* |
|
|
|
|
Median |
14.2 |
14.1 |
12.9 |
14.2 |
P5 – P95 |
9.0 – 21.9 |
9.1 – 21.9 |
10.1 – 22.1 |
9.1 – 19.4 |
variable |
Pregnant women |
|
Non-pregnant women |
|
||
|
TPO + |
TPO ‒ |
P-value |
TPO + |
TPO ‒ |
P-value |
TSH* |
|
|
|
|
|
|
Median |
1.6 |
0.8 |
0.001 |
2.1 |
1.7 |
0.05 |
P5 – P95 |
0.2 – 4.2 |
0.05 – 2.8 |
0.03 |
0.75 – 5.5 |
0.6 – 3.95 |
----- |
fT4* |
|
|
|
|
|
|
Median |
11.6 |
14.1 |
0.03 |
14.1 |
12.9 |
0.150 |
P5 – P95 |
7.7 – 25.1 |
9.1 – 21.9 |
----- |
9.1 – 23.1 |
9.1 – 19.3 |
----- |
Study |
Country |
Sample size and |
Centiles’ used |
TSH reference intervals 1st trimester |
Non-pregnant women |
Preset study 2019 |
Iran |
Cohort |
P5 – p95 |
0.05 – 2.8 |
0.6 – 3.95 |
Azizi F 2012 |
Iran |
Cohort |
P5 – p95 |
0.20 – 3.90 |
----- |
Delshad 2021 |
|
|
|
|
|
Mehran L 2013 |
Iran |
Cohort |
P5 – p95 |
0.20 – 3.90 |
----- |
Karakosta 2011 |
Greece |
Cohort |
P2.5 – P97.5 |
0.05 – 2.53 |
------ |
Nazarpour S2018 |
Iran |
Cohort |
P2.5 – P97.5 |
0.14 - 6.14 |
------ |
Kianpour et al. 2019 |
Iran |
cross sectional |
P2.5 – P97.5 |
0.20–4.60 |
0.59–5.60 |
Zhang D et al. 2019 |
China |
Cohort |
P5 – P95 |
0.02 – 3.78 |
----- |
Kim H et al. 2018 |
S. Korea |
Cohort |
P5 – P95 |
0.03 – 4.24 |
------ |
Kostecka-Matyja, M2017 (24) |
Poland |
Cohort |
P5 – P95 |
0.009-3.177 |
------ |
Khalil A et al. 2018 |
UEA |
Cohort |
P5 –P95 |
0.094 – 3.33 |
------ |
Ollero MD |
Spain |
Longitudinal |
P5 – P95 |
0.13 – 4.16 |
------- |
Goel et al 2021 |
India |
Cross-sectional |
P5 – P95 |
0.59 –4.48 |
------ |
Castillo C et al.2018 |
Chile |
Cross-sectional |
P2.5 – P97.5 |
0.13 – 5.37 |
----- |