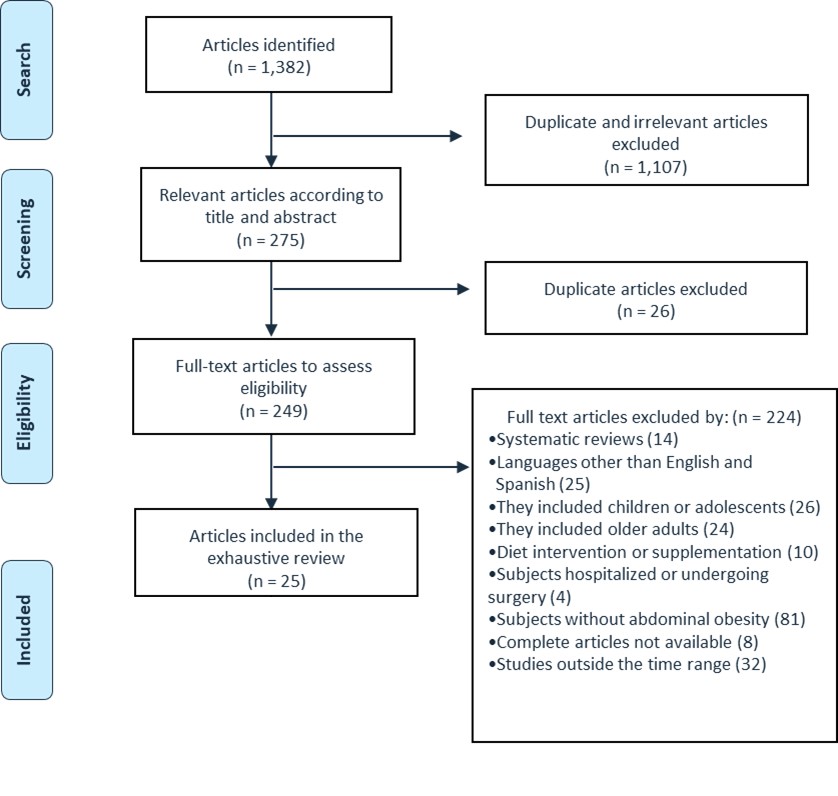
Figure 1: PRISMA Flow Chart

#

Authors                  (year)

study            design

country                of study

Number                                                                                                                                                                        of participants

Sex                          (%)

Age                                                                                                            (years)

Intervention

Duration

metabolic                                                                                                                                                                                                                                                                                                                                             expense

body composition

Physical                                                                                                                                                                                                                                                                                                                                                                                                                                                                                                                                                                                                                                                                                                                           activity

quality              score

1

Jyothi R.               (2010)

case and control

India

340 obese and non-obese

100% M

18-60

First phase: determine the prevalence of abdominal obesity.                                                                                                                                                                                                                                                                                                                                                                   Second phase: compare obesity risk between obese and non-obese.


A significant association between PA and                                                                                                                                                                                                                                                                                                                                                                                                                                                                                                                                                                                                                                           abdominal obesity (OR 0.417, 95% CI 0.180-0.968)

47.10%

2

Karamzad N.           (2019)

case and control

Iran

164 subjects with                                      abdominal obesity

50%H, 50%M

18-60

Application of the IPAQ to classify subjects into low-level AF, moderate-level AF, and high-level AF.                                                                                                                                                                                                                                                                           Evaluation of biochemical and anthropometric parameters.


Half of the cases and controls had PA between high (3000 or more METs)                                                                                                                                                                                                                                                                                                                                                                                                                                                                               and moderate (600-3000 METs), respectively.                                                                                                                                                                                                                                                                                                                                                                                                                                                                                                                                                                                         No significance was found between PA levels and the incidence of metabolic syndrome                                                                                                                                                                                                                                                                                                                                                                                                                                                    (moderate PA [OR 0.69, 95% CI 0.24-1.97];                                                                                                                                                                                                                                                                                                                                                                                                                                                                                                                                                                                                                                                                                                         high PA [OR 1.25, 95% CI 0.44-3.55])

69%

3

Martinez C.            (2011)

cross-section

Spain

49

47%F, 53%F

54.84  ± 4.56

Anthropometric and dietary assessment.                                                                                                                                                                                                                                                                                                                                                                                           BMR estimation by Harris-Benedict and FAO/WHO calculation  


39.1% of men and 26.9% of women had abdominal obesity.                                                                                                                                                                                                                                                                                                                                                                                                                                                                                                               PA was between light and very light (PA for men 1.45 and PA for women 1.40).

22%

4

Rahmania A.         (2014)

cross-section

Iran

161 subjects with or                                      without coronary disease

52%F, 48%F

60.5 ± 18.8

Underwent coronary angiography for stable angina.                                                                                                                                                                                                                                                                                                                                                                       Bioimpedance analysis was performed to measure adipose tissues and MM.


The mean levels of WC and BF were significantly                                                                                                                                                                                                          higher in the group with coronary disease. MM was                                                                                                                                                                                                     also significantly higher in the group without CHD.


47.90%

5

Lopes E.                (2010)

cross-section

Brazil

40 overweight and eutrophic

100% M

Overweight (G1) = 36.62 ± 7.76                                                 Eutrophic (G2) = 35 ± 7.52 years

Anthropometric, dietary, and body composition evaluations were carried out through bioimpedance.                                                                                                                                                                                                                                                                                              PA was evaluated through an accelerometer and energy metabolism through indirect calorimetry.


The women of group 1 presented a BMR of                                                                                                      1488.58 kcal and a WC of 96.78 cm,                                                                                                                                                                                                                                while the women of group 2 showed a                                                                                                               BMR of 1194.71 kcal and a WC of 73.81 cm.


G1 presented higher WC (p<0.05) compared to G2. 38.46% and                                                                                                                                                                                                                                                                                                                                                                                                                                                                                                                                                         50% of women in G1 and G2 respectively were sedentary.                                                                                                                                                                                                                                                                                                                                                                                                                                                                                                       Both groups were classified as sedentary.

28.20%

6

Rocha L.                (2017)

cross-section

Brazil

106

23.6% F, 76.4% F

18-60

They were divided into three groups according to vitamin D levels: deficiency, insufficiency, and sufficiency.                                                                                                                                                                                                                                                              Anthropometric and body composition evaluations were made with bioimpedance and biochemical and clinical evaluations.


The vitamin D deficient group had 41% BF,                                                                                                                                                                                                                                       the deficient group 36%, and those with sufficient vitamin D levels 32%.

High WC was observed in those with vitamin D deficiency.                                                                                                                                                                                                                                                                                                                                                                                                                                                                                                                      However, the prevalence of a sedentary lifestyle was higher in patients with sufficient vitamin D                                                                                                                                                                                                                                                                                                                                                                                                                                                                                                                                                                             (35.8 ± 4.61) abdominal obesity and lower in those with vitamin D deficiency (18.0 ± 2.62).

58.60%

7

Momesso D.         (2011)

control case

Brazil

45 subjects with type 1 diabetes                                                                                                                 mellitus and metabolic syndrome                                                                                                                 or type 1 diabetes mellitus

100% M

36 ± 9

Body composition and insulin resistance were determined by                                                                                                                                                                                                                                                                                                                                                              dual-energy X-ray absorptiometry and eGSR, respectively.


Total body fat and peripheral fat were similar between groups.                                                                                                                                                                           Central fat was negatively correlated with eGSR.

Total body fat and peripheral fat were similar between groups.                                                                                                                                                                                                                                                                                                                                                                                                                                                                                                                                                                          Central fat was negatively correlated with eGSR.

43.20%

8

Alvarez C.             (2019)

Experimental

Chili

89 obese/overweight inactive                                                                                                                  hyperglycemic subjects

100% M

30-59

They were randomly assigned to a TC group or control group.

20 weeks


3.00%

9

Cruz J.                     (2018)

cross-section

Mexico

50

44%F, 56%F

19-25

They completed a questionnaire aimed at evaluating food intake,                                                                                                                                                                                                                                                                                                                                                                                                  in addition, biochemical and body composition parameters were collected.


Regarding the % BF, a high occurrence of overweight (22%)                                                                                                                                                                                        and obesity (38%) was found. Furthermore,                                                                                                                                                                                                             visceral fat increased as WC increased.

Regarding the % BF, a high occurrence of overweight (22%) and obesity (38%) was found.                                                                                                                                                                                                                                                                                                                                                                                                                                                                                                                                                                                                                                                                                                                                                             Furthermore, visceral fat increased as WC increased.

62.20%

10

Garcia T.                (2020)

Experimental

Spain

41

83.3% F, 16.7% F

28-58

They were assigned to an intervention group of a Pilates program of two weekly sessions or a control group.

20 weeks


The intergroup analysis showed significant differences for each of the variables, including WC in pre and post-intervention.

0.00%

11

Share B.                 (2015)

Experimental

Australia

62

100% M

18-30

They were assigned to a PA lifestyle intervention group (2 progressive circuit sessions and one unsupervised session at home),                                                                                                                                                                                                                                                                                                                                   nutritional education, and cognitive-behavioral therapy or a control group.

12 weeks

The intervention group presented an increase in                                                                                                 VO2 max by 4.7 ml kg-1 min-1 or 15%.                                                                                                                                                                                                                   In addition, differences are observed in terms of                                                                                                 total caloric intake which decreased by 1312 kJ or 22%.


There were significant changes in the intervention group before and after WC (-5.8 cm, -6.4%, p=<0.05).                                                                                                                                                                                                                                                                                                                                                                                                                                                                                                                                                                The control group also showed improvements in WC before and after (-5.6cm, -6.2%) Likewise, in AF (+183 min-week, +9.7%).                                                                                                                                                                                                                                                                                                                                                                                                                                                                                                                                        PA was higher after the intervention in the intervention group as opposed to the control group.

3.00%

12

Ross R.                  (2015)

Experimental

Canada

300

65.3% F, 34.7% F

51.4 ± 8.1

They were assigned to a control group or an intervention group with three different programs:                                                                                                                                                                                                                                                                                       exercise of low quantity and intensity (LALI)                                                                                                                                                                                                                                                                                                                                                                                                                                          exercise of high quantity and intensity (HAHI)

24 weeks


The 24-week reductions in WC were significant and greater in LALI (-3.9cm, p=<0.001),                                                                                                                                                                                                                                                                                                                                                                                                                                                                                                                                                                                                                                                                                                                                                                                                                           HALI (-4.6cm, p=<0.001), and HAHI (-4.6, p=<0.001)                                                                                                                                                                                                                                                                                                                                                                                                                                                                                                                                                                                                                                                                                                                                                                   compared with the control group, but did not differ between the intervention groups.

3.00%

13

Sukala W.             (2013)

Experimental

New Zealand

18

72.2% F, 27.8% F

49 ± 5

They were randomly assigned to resistance training or aerobic training 3 times per week.

16 weeks


No association between PA and abdominal obesity was determined.

3.00%

14

Your Birth A.          (2015)

cross-section

Brazil

73

69.8% F, 30.2% F

55.7 ± 11.2

PAD prevalence was assessed using ABI,                                                                                                                                                                                                                                                                                                                                                                                            quality of life was measured using a questionnaire, PA was measured using a modified Baecke questionnaire,                                                                                                                                                                                                                                                                             and body composition was measured using impedance.


Analysis of body composition detected an excess of BF,                                                                                                                                                                                      especially in women, but there was no difference between the groups.

Physical activity did not differ between patients with PAD and those with normal ABI.                                                                                                                                                                                                                                                                                                                                                                                                                                                                                                                                                                                                                                                                                                                                                                       No significant relationship was found between ABI values and PA questionnaire scores.

80%

15

Mogre V.              (2012)

cross-section

Ghana

186

65%H, 35%M

20-59

The dietary pattern was evaluated through food frequency questionnaires and                                                                                                                                                                                                                                                                                                                                  PA was determined through the WHO world levels questionnaire.


10% of the subjects performed physical activity at a high level and 30% at a moderate level, and 60% at a low level.                                                                                                                                                                                                                                                                                                                                                                                                                                                                                                                                                                                                                                                                                                                                             The prevalence of central obesity decreased with AF. Women had a higher risk of central obesity than men.

73.10%

16

Mogre V.              (2014)

cross-section

Ghana

646

445H, 201M

23.06 ± 2.77

Anthropometric measurements were taken.                                                                                                                                                                                                                                                                                                                                                                                              The GPAQ questionnaire was applied to measure the level of PA


The prevalence of abdominal obesity was 4.2%,                                                                                                                                                                                                         being higher in women at 11.9%, compared to men at 0.7%.

In general, 14.7% performed light PA, 48.8% moderate PA, and 36.5% vigorous PA.                                                                                                                                                                                                                                                                                                                                                                                                                                                                                                                                                                                                                                                                                                          Of the 27 students with abdominal obesity, 22.2% performed light PA, 44.4% moderate PA, and 33.3% vigorous PA.                                                                                                                                                                                                                                                                                                                                                                                                                                                                                                                                                                            However, the differences were not significant when stratifying abdominal obesity by PA level.

81.50%

17

Gremeaux V.          (2012)

Cohort

Canada

62 overweight and                                            obese subjects

64.5%H, 35.5%M

53.3 ± 9.7

A program on nutritional counseling, optimized high-intensity interval exercise,                                                                                                                                                                                                                                                                                                                                   and resistance training 2-3 times per week were performed. Anthropometric and cardiometabolic measurements were also made.

9 months


The prevalence of metabolic syndrome was reduced to 32.5% after completing the program (pre= n=37 vs post= n=25).                                                                                                                                                                                                                                                                                                                                                                                                                                                                                                                                                                                                                                                       Thirty-two patients who responded to WC reduction were identified, with a reduction of -5.8 cm or -5.15%

73.50%

18

Martinez E.           (2017)

cross-section

Colombia

236

100% H

30-60

Anthropometric data and biochemical body composition were recorded.                                                                                                                                                                                                                                                                                                                                                The Adult Treatment Panel III criteria were used to define metabolic syndrome.                                                                                                                                                                                                                                                                                                                 Metabolic syndrome components were calculated and correlated with body composition measures.


The WC above 102cm was found in 11.8%.                                                                                                                                                                                                                         BMI and %BF correlated well with waist, blood pressure,                                                                                                                                                                                         fasting blood glucose, and triglycerides.


51%

19

Marbou W.           (2019)

cross-section

Cameroon

604

57.45%H, 42.55%M

43.74 ± 17.21

Interviews, physical, clinical, and biochemical examinations were carried out.                                                                                                                                                                                                                                                                                                                                                                                               The definition of metabolic syndrome of the International Diabetes Federation was used.


He reported that patients with metabolic syndrome are more likely to have high WC compared to normal patients.                                                                                                                                                                                                                                                                                                                                                                                                                                                                                                     A significant relationship was observed between moderate (OR0.65; 95% CI 0.42-0.98) and high (OR 0.30; 95% CI 0.12-0.72) PA and central obesity.

89.20%

20

Shrivastava U.     (2017)

Experimental

India

267 overweight                                              subjects

85.8% H, 14.2% F

22-55

A multicomponent intervention was performed at the intervention sites.                                                                                                                                                                                                                                                                                                                                      They received topics on diet, PA, and healthy living, and 2 sessions were held on each topic.                                                                                                                                                                                                                                                                                                      Topics on stress management and two training sessions were also given.

6 months


There was a decrease in WC in the intervention group (-1.55 cm).                                                                                                                                                                                                                                                                                                                                                                                                                                                                                                                                                                                                                                                                                                                                                                                                                                                                                                                                                                                                                                                                                The sedentary lifestyle was significantly reduced. In the intervention group, more people changed from a sedentary lifestyle to a more active one,                                                                                                                                                                                                                                                                                                                                                                                                                                                                                                                                                 compared to the control group.

3.00%

21

Cowan T.              (2018)

Experimental

Canada

300

60%M, 40%H

52.8 ± 7.6

The subjects were divided into four groups:                                                                                                                                                                                                                                                                                                                                                                                    Control Exercise of high quantity and low intensity (HALI)                                                                                                                                                                                                                                                                                                                                                              High quantity and intensity (HAHI)                                                                                                                                                                                                                                                                                                                                                                                                          Low quantity and intensity (LALI)                                                                                                                                                                                                                                                                                                                                                                                                                                                                               Activities of daily living were measured with an aWCelerometer.

24 weeks

Regarding VO2, there were no differences between the                                                                                    groups that received a                                                                                                                                                                                                                              low amount and low intensity of exercise and                                                                                                     the group that received a low amount and high intensity.


WC was reduced in all exercise groups compared to the control,                                                                                                                                                                                                                                                                                                                                                                                                                                                                                                                                                          but the reduction value did not differ between exercise groups.                                                                                                                                                                                                                                                                                                                                                                                                                                                                                                                                                                                                                                                                                                                                                                                                                                                                                              LALI (-5.1cm), HALI (-6.6cm) and HAHI (-6.2cm)

2.00%

22

Stensvold D.        (2010)

Experimental

Norway

43

60.5%H, 39.5%M

50.9 ± 10.4

They were assigned to one of these four groups:                                                                                                                                                                                                                                                                                                                                                                        Control Aerobic interval training Strength training Combination of AIT (aerobic)                                                                                                                                                                                                                                                                                                                        and ST (strength) Each training was performed 3 times per week.

12 weeks


The control group had an increase in WC while all three intervention groups had a significant decrease:                                                                                                                                                                                                                                                                                                                                                                                                                                                                                                                                                                                                                                                                                                                                                                                                                     AIT (-1.3 cm), COM (-0.74cm), ST (-1.4cm)                                                                                                                                                                                                                                                                                                                                                                                                                                                                                                                                                                             However, only the AIT and ST groups had a significant reduction in WC compared to the control group.

4.00%

23

Cramer H.              (2016)

Experimental

Australia

60

100% M

18-64

They were randomly assigned to a yoga intervention or a control group

12 weeks


Thirteen participants in the yoga group (32.5%) achieved a relevant decrease in WC of less than 5% (-3.7cm)                                                                                                                                                                                                                                                                                                                                                                                                                                                                                                                                                                                                                                                                                                compared to two participants in the control group (10%).

3.00%

24

Skrypnik D.           (2015)

Experimental

Poland

44

50%M, 50%H

18-65

They were randomly assigned to group A (endurance training on cycle ergometers)                                                                                                                                                                                                                                                                                                                                                    or group B (endurance or strength) 3 times per week for 60 min.

3 months


Both groups resulted in a decrease in WC Group A (-5.26cm), and Group B (-7.65cm), without significantly differing values between the groups.

2.00%

25

Pantovic A.          (2019)

cross-section

Serbian

87

60.92% F, 39.08% F

28-56

They were divided according to sex and anthropometric, bioimpedance, and                                                                                                                                                                                                                                                                                                                   biochemical parameters were evaluated.                                                                                                                                                                                                                                                                                                                                                                                                                                             The results were compared according to sex and according to the month of evaluation.

2 months


Most parameters measured by anthropometry                                                                                                                                                                                                                and bioimpedance increased in those adults with                                                                                                                                                                                                       vitamin D deficiency, including %FM and WC.


82.20%

Table 1: Studies included in the systematic review.