ANNEX PUBLISHERS

Journal of Nutrition and Health Sciences

ISSN: 2393-9060

Open Access
Review Article
Max Screen

Central Obesity, Physical Activity, Basal Metabolism, and Body Composition in Adults: A Systematic Review

Génesis Chen
AFFILIATIONS
1Nutrition School, University of Panama. Panama City, Panama. GC (genesischen1519@gmail.com); CL (claudialora96@hotmail.- com); VV (victoria.valdes@up.ac.pa); FP (fabianapiran@gmail.com); IR-C. (israel.rios@up.ac.pa)
Claudia Lora
AFFILIATIONS
1Nutrition School, University of Panama. Panama City, Panama. GC (genesischen1519@gmail.com); CL (claudialora96@hotmail.- com); VV (victoria.valdes@up.ac.pa); FP (fabianapiran@gmail.com); IR-C. (israel.rios@up.ac.pa)
Diana Rodríguez
AFFILIATIONS
Medicine School, University of Panama. Panama City, Panama. DR (dianalynnrv@yahoo.com);
Victoria Valdés
AFFILIATIONS
Nutrition School, University of Panama. Panama City, Panama. GC (genesischen1519@gmail.com); CL (claudialora96@hotmail.- com); VV (victoria.valdes@up.ac.pa); FP (fabianapiran@gmail.com); IR-C. (israel.rios@up.ac.pa)
Fabiana Pirán
AFFILIATIONS
Nutrition School, University of Panama. Panama City, Panama. GC (genesischen1519@gmail.com); CL (claudialora96@hotmail.- com); VV (victoria.valdes@up.ac.pa); FP (fabianapiran@gmail.com); IR-C. (israel.rios@up.ac.pa)
Alex Brito
AFFILIATIONS
Pharmacocinetic Laboratory and Metabolomic Analysis, Traslational Medicine Institute; Biotechnology, IM Sechenov First Medical University of Moscow, Moscow, Russia; AB (abrito@labworks.ru)
and Israel Ríos-Castillo
AFFILIATIONS
Nutrition School, University of Panama. Panama City, Panama. GC (genesischen1519@gmail.com); CL (claudialora96@hotmail.- com); VV (victoria.valdes@up.ac.pa); FP (fabianapiran@gmail.com); IR-C. (israel.rios@up.ac.pa)
Food and Agriculture Organization of the United Nations. Sub Regional Office for Mesoamerica. Panama City, Panama. IR-C
Corresponding author (Address):
Israel Ríos-Castillo, Food and Agriculture Organization of the United Nations. Sub Regional Office for Mesoamerica. Panama City, Panama. IR-C, Tel.: +507 65819767, E-mail.: israel.rios@fao.org
Received Date: July 28, 2023 Accepted Date: August 28, 2023 Published Date: August 30, 2023

Copyright: © 2023 Israel Ríos-Castillo. This is an open-access article distributed under the terms of the Creative Commons Attribution License, which permits unrestricted use, distribution, and reproduction in any medium, provided the original author and source are credited.

Related article at Pubmed, Google Scholar

Abstract

Introduction: Obesity is a global epidemic with serious consequences for countries.

Objective: This work aims to systematically review the available evidence on the relationship between basal metabolism (BM), body composition, and physical activity (PA) with central obesity.

Methodology: The search strategy was carried out using Web of Science, PubMed, Google Scholar, and SciELO following the PRISMA guidelines. The STROBE checklist and the Jadad scale were also used for quality assessment.

Results: Initially, a total of 1382 studies were identified, with 25 publications eligible for systematic data extraction. The reviewed studies showed that adults with a waist circumference (WC) greater than 88 cm in women and greater than 102 in men had a higher risk of metabolic disturbances related to high absolute energy expenditure and lower maximal oxygen consumption (VO2 max). Participants with central obesity had a high percentage of body fat (%BF) between 30.6% and 41.6%. Most PA intervention studies reported reductions in WC between 1.3 and 5.8 cm

Conclusions: In conclusion, there is a direct relationship between the components of BM with central obesity and a direct association between central obesity and %BF. PA is a protective factor that should be promoted to reduce WC and control central obesity as a public health problem. PROSPERO identification record: CRD42021232917.

Keywords: central obesity; waist circumference; physical activity; basal metabolic rate; body composition

Introduction

Obesity is a chronic condition that has become a serious public health problem, considered by the World Health Organization (WHO) as an epidemic, due to its exponential increase since the early eighties [1]. The WHO defines obesity as an abnormal or excessive accumulation of fat, which has negative effects on health [2]. In recent years, an increase in obesity has been observed, commonly expressed as an increase in waist circumference (WC) (central obesity) [3]. This accumulation of fat at the level of visceral adipose tissue (VAT) has been related to metabolic abnormalities that contribute to the development of non-communicable diseases (NCDs) such as type 2 diabetes, cardiovascular diseases, arterial hypertension, and various types of cancer [4]. Currently, obesity affects 13.1% of adults worldwide [5].

The basal metabolic rate (BMR) or basal metabolism (BM) is defined as the minimum amount of energy that the body requires to be alive [6]. The BM can be determined through predictive equations or indirect calorimetry, the latter being the most accurate method [6]. Energy expenditure can be increased by the energy used in the practice of physical activity (PA), this being the most fluctuating component of energy expenditure [7]. Body size, body composition, age, gender, and other factors such as diet, energy drink consumption, and smoking have also been reported to be modifiers of BM [7].

The relationship between muscle mass (MM) and maximum oxygen consumption (VO2 max) has been widely studied [8-11]; especially, the percentage of body fat (%BF) and MM, which are the tissues most modulated by PA and eating habits [8]. Although the relationship between metabolic expenditure, physical activity, and abdominal obesity has been previously described, it will be important to evaluate it considering the new findings published in the last decade. The exponential increase in obesity together with political and social concern about the associated impact has influenced the interest of countries in improving the quality of life of their populations and investing in public health interventions to reduce this disease.:

Through this review, using systematic and explicit search to identify, select and critically appraise the available literature, we aimed to systematically review the available evidence on the relationship between basal metabolism (BM), body composition, and physical activity (PA) with central obesity. All articles were identified in Medline, Scopus, Scielo, and other Internet-based academic search engines.

Methodology
Eligibility and Identification of Studies

Studies considered eligible for this review were limited to randomized, controlled, experimental and observational study designs investigating the relationships between BM, body composition, and (PA) with central obesity in adults of different age groups, ethnicities, and genders. The search and selection of studies were carried out between April and November 2020.

The selection included the projection of titles and abstracts of each article. Studies that met the following criteria were selected: research articles published between 2010 and 2020, including adults of both sexes between 18-65 years of age and with central obesity. Articles were searched using the Web of Science, PubMed, Google Scholar, and SciELO databases, selecting studies published in English between 2010 and 2020.

A combination of the following keywords was used: [basal metabolic rate], [physical activity], [body composition], [abdominal obesity], [central obesity], and [visceral obesity]. Preferred reporting items for systematic reviews and meta-analyses (PRISMA) guidelines were followed. The protocol for this review is available from The International Prospective Register of Systematic Reviews (PROSPERO) with registry number CRD42021232917.

Data Extraction

A digital form was developed using Google Tools (Google LLC, Mountain View, CA, USA) to extract relevant data from each study, such as title, year, journal, authors, country, objective, sample, and study design. In addition, information on the interventions, a summary of results, and conclusions were extracted. During data extraction, attention was paid to the possible inclusion of duplicate items. Articles were screened and information was extracted only from those studies with confirmed eligibility

Quality Assessment

The quality of the observational studies (cohort, cross-sectional, and case-control study designs) was assessed using the Strengthening the Reporting of Observational Studies in Epidemiology (STROBE) checklist, related to structure and the content of observational studies. The checklist consists of 22 items grouped into six topics (such as title and abstract; introduction, methods, results, discussion, and other information. The use of the checklist is to ensure that all important aspects of the study are reported and that readers can assess the quality and applicability of the study results. This checklist is widely used by researchers, journals, and reviewers to improve the reporting of observational studies. The final scores were converted into percentages [12]. To classify the studies according to their methodological quality, three classifications were established considering the 22 points (100%): high (100% -80%), moderate (79% -40%), or low quality (39% or less).

In addition, the Jadad scale, also known as Jadad scoring the Oxford quality scoring system, was used to assess the quality of the experimental studies. It is a scale made up of five questions that include only aspects related to biases, defined by: randomization techniques, masking (double-blind) that prevents patients and the researcher himself from accessing the object of treatment; and description of follow-up losses. The Jadad scale is a simple questionnaire, quick to apply, and has been validated. Through these seven questions, an assessment of the validity of a clinical trial can be made. To classify the studies based on their results, those with five points were considered rigorous and those with less than three points were considered of poor quality, considering that each question represented one point [13].

Results
Systematic Search
Description of Studies

Table 1 summarizes the main findings reported in the selected studies. Most of the articles had a cross-sectional (n= 11) [14-24] and experimental (n= 10) study design [24-34]. Three studies were case-control [35-37], and one was a cohort study design [38]. These studies recruited a total of 4073 participants and the majority included individuals of both sexes (n=18). However, six studies were limited to women only and one to men only. Ten of the selected studies included participants with comorbidities associated with central obesity, including hyperglycemia (n=1), type 1 diabetes mellitus (n=1), type 2 diabetes mellitus (n=2), vitamin D deficiency (n=2), coronary artery disease (n = 1) and metabolic syndrome (n = 2).

Quality Assessment

The methodological quality of the observational studies assessed through the STROBE checklist ranged from moderate to high quality (58.4% and 83.2%). Most of the studies presented problems in measures to deal with possible biases, estimation of sample sizes, control of independent variables, treatment of missing data, description of the loss of participants, and specification of study financing. On the other hand, in the experimental studies evaluated through the Jadad scale, the majority presented a low methodological quality with an average of three points, presenting problems mainly in the masking or double-blinding method. Most studies had problems with measures to address bias, control for independent variables, treatment of missing data, and description of the loss of participants. The quality scores of the studies included in the systematic review are included in Table 1.

Basal Metabolism Studies

Two studies evaluated the relationship between central obesity and BM. One of these studies found an inverse relationship between central obesity and BM determined by maximum oxygen consumption (VO2 max) [27]; while the other study indicated a direct relationship between central obesity and BM 17. The second study divided the sample into two groups. The women of group 1 presented an average BM of 1488.6 Kcal and a WC of 96.8 cm, while the women of group 2 presented a BM of 1194.7 Kcal and a WC of 73.8 cm. A greater risk of metabolic conditions was reported in group 1 related to greater absolute energy expenditure and a WC greater than 88 cm [17]. To determine VO2 max in people with central obesity, another study divided participants into three groups based on the amount of PA prescribed and reported a reduction in WC in all groups compared to the control group [30]. Regarding VO2 max, there were no significant differences between the groups according to the amount and intensity of PA [17,30].

Studies on Body Composition

A study carried out on workers reported that between 11.8% and 43.2% of them had a WC greater than 102 cm [19]. They found that the %BF increased concerning WC [19]. Three studies found that a high % BF increases cardiovascular risk [14,15,24]. Participants with and without coronary disease were studied, reporting a directly proportional relationship between WC and %BF, presenting a higher %BF in the group with coronary disease (30.6%) compared to the group without coronary disease (21.1%) [15].

One study evaluated 45 women diagnosed with type 1 diabetes mellitus and divided them into two groups: those with and without metabolic syndrome. In the group with metabolic syndrome, the WC was higher (89 cm) than in the group without metabolic syndrome (79.8 cm). In the same study, the metabolic syndrome group had a %BF greater than 38.4%, suggesting that this central fat deposit is an important contribution to metabolic syndrome [37]. Two investigations evaluated body composition and central obesity using WC measurements in vitamin D deficient individuals based on serum 25(OH)D levels (< 20 ng/mL or < 50 nmol/L) and their findings indicated that there was a direct relationship between this vitamin D deficiency and WC that can be explained by the accumulation of vitamin D in adipose tissue [18,23]. The WC was higher (119.93 cm) in the group with vitamin D deficiency, compared to the group with adequate levels (100 cm) [18].

Studies on Physical Activity

Three studies reported a significant inverse relationship between PA and the prevalence of central obesity, indicating that non-regular PA represents a higher risk of central obesity [20,27,35]. One of these studies in which the association between central obesity and PA was evaluated in 340 obese and non-obese women reported a significant inverse relationship between these two variables with an OR (95% CI) of 0.417 (0.180-0.968), p= 0.031 [35]. Most of the studies based on interventions of a physical training program, regardless of its duration or type of exercise, reported significant improvements in WC [21,22,25-29,32,38]. Most of these studies reported a reduction in WC between -1.3 cm and -5.8 cm. Three studies indicated that regardless of PA type, intensity level, or amount, the intervention groups had similar reductions in WC, with no significant differences between groups [28,30,33]. Regarding those studies that evaluated PA through questionnaires or accelerometers, the majority indicated that the majority of the participants performed a level of PA between mild and moderate [20-22,35,36].

In a study in which participants were divided into three groups based on serum 25(OH)D level (deficient: < 20 ng/mL, insufficient: 20-29.9 ng/mL, and sufficient: 30-100 ng/ mL), a high prevalence of central obesity was observed in the group deficient in vitamin D. However, the highest percentage of sedentary lifestyle was found in the group of individuals with sufficient levels of vitamin D [18].

One of the studies, based on comparisons between obese and overweight, carried out an intervention program of nutritional advice and physical training, specifically high intensity, and resistance, and reported that 51% of the participants presented a reduction in WC after the intervention. In addition, the prevalence of metabolic syndrome decreased to 32.5% after intervention [38].

Discussion

The findings of this systematic review suggest a significant inverse relationship between BF measured by VO2 max and central obesity (WC >102 cm in men and >88 cm in women) [17,27,30]. Studies reported that PA interventions were directly associated with an increase in VO2 max, a decrease in WC, and an increase in overall physical performance [27,30]. This was previously reported, reporting an inverse relationship between WC and VO2 max, highlighting the importance of increasing PA to improve the components of physical fitness and BM in adults [39].

In one of the studies where a PA intervention was performed for 12 weeks, it was reported that the intervention group had an increase in VO2 max, in addition to a decrease in WC [27]. This coincides with other studies carried out in periods close to 12 weeks, where high-intensity training in populations with central obesity had a significant impact on the improvement of physical performance parameters and metabolic health, such as VO2 max [40,42].

The studies analyzed in this systematic review confirm the relationship between WC and central obesity. Studies reported individuals who, subjected to a body composition analysis, presented a WC above healthy values, in turn, presented a high %BF [14,22,24]. These findings are similar to those found in postmenopausal women, where it was observed that women with higher WC had a high %BF and in turn had a 6.9 times greater risk of suffering from metabolic syndrome than those with a lower %BF [43].

The findings reported by the identified studies suggest that in individuals with central obesity and %BF ≥ 30%, cardiovascular risk is one of the factors that are increased, compared to those with a healthy %BF. This was observed in three of the studies that evaluated populations with conditions associated with central obesity, such as type 2 diabetes mellitus and coronary disease [14,15,24]. These findings are consistent with those reported by Patino et al., in 2011 to evaluate the factors associated with increased cardiovascular risk, where it was found that one of the most detrimental factors was central obesity (52.7%), especially in women (p< 0.05) [44]. Similarly, Oviedo et al., (2006) reported a direct association between central obesity and coronary disease [45].

Based on the included studies, we highlight the importance of considering the implementation of individual interventions that detect populations with higher cardio-metabolic risk by measuring WC and body composition at the primary health system level or through community work. In addition, it would be of great help to always consider communication campaigns and food and nutrition education on the importance of maintaining a healthy WC and promoting better eating habits, as well as having policies such as the front-of package (FoP) nutrition warning labels that would contribute to the development of a healthy food environment and would empower the population towards better food choices.

Findings linking the relationship between central obesity and body composition with vitamin D deficiency, indicate that people with this deficiency may be more predisposed to elevated WC and elevated %BF [18]. The reasons why this association has been found are still a matter of scientific discussion. These relationships are likely explained by the role played by vitamin D (liposoluble vitamin) in adipose tissue, since an adequate vitamin D status is related to mechanisms of modulation of the inflammatory response, reduction of adipogenesis, and, therefore, less secretion of adipocytes [46]. This is consistent with a study where vitamin D levels of postmenopausal women were investigated and related to body adiposity, reporting that women with central obesity had higher %BF and vitamin D deficiency according to serum 25(OH)D levels (deficient: ≤20 ng/mL, insufficient: 21-29 ng/mL, and sufficient: ≥30 ng/mL) [47]. Based on this, it is important to carry out new studies with more adequate designs, preferably case-control studies, cohort studies, or experimental studies that provide more reliable results and allow a deep understanding of the relationship between central obesity and vitamin D deficiency. PA interventions in individuals with vitamin D deficiency and central obesity may probably be less effective in reducing WC than in individuals with adequate vitamin D status.

Pharmacological methods :Use of alcohol, opium and its derivatives and hashes provided some relaxation.The opium, which comes from the poppy plant, has a long history of use in human culture. Seeds of the poppy plant have been found in prehistoric Swiss Lake dwellings and in Egyptian ruins [7]. It was Ibn Sina (980-1037 AD), generally known as “Father of Early Modern Medicine”, who praised opium as the most powerful of stupor producing substance [15].

In this sense, the literature reports that a higher WC and prevalence of central obesity in individuals with vitamin D deficiency, compared to those without vitamin D deficiency, despite having similar PA regimens [48]. Based on these findings, vitamin D supplementation in conjunction with PA intervention in individuals with hypovitaminosis D and central obesity is suggested as a topic for future research, which would clarify the extent of this deficiency as a factor that negatively affects PA is less efficient on central obesity.

The analysis of the relationship between central obesity and PA suggests that non-regular PA has a detrimental relationship with central obesity, which coincides with previous findings who indicated a direct association between a style of continuous sedentary life and central obesity, showing increases in WC in episodes of greater sedentary lifestyle [49]. [46] It has been reported a similar association between a sedentary lifestyle and central obesity, with a sedentary lifestyle being a predictor of central obesity compared to physical activity [50].

The studies analyzed showed that PA interventions could contribute to the reduction of WC. Consistently, it has been reported responses on WC attributable to exercise. They reported significant decreases in WC in eight of 14 exercise intervention groups, compared with controls, in different experimental studies [51]. The findings reported by the studies identified in the present systematic review suggest that a similar reduction in WC can be achieved, regardless of the type of PA performed. However, it has been reported that aerobic exercise, even below the recommendations for obesity management, was considered effective in reducing visceral fat, while resistance exercise failed to achieve significant reduction of visceral fat, compared to a control group [52]. Parque et al., (2003) indicated a greater effect of the combination of aerobic and resistance exercises on visceral fat compared to aerobic training alone [53]. However, t has been found that the WC reductions do not have significant differences between the intervention groups when applying three different training programs: aerobic exercise, resistance exercise, and combined resistance and aerobic exercise [31].

Regarding the intensity and quantity of exercise, different studies are inconsistent regarding its relationship with central obesity. Ismael et al., (2012) did not find a relationship between the intensity or amount of exercise and the decrease in abdominal fat 50. In this sense, they did not find a dose-response relationship between the intensity of the exercise and the reduction of the WC, but they did find a relationship between the amount of exercise and the reduction of the WC, showing a significantly greater decrease in abdominal fat in the exercise group with the high amount and vigorous-intensity of PA, compared with other exercise intervention groups (low amount and moderate intensity, low amount and vigorous intensity) [54] . It has been also suggested a linear dose-response association between the level of PA and the change in WC, so that a greater PA generates a greater impact on abdominal adiposity [55].

New studies are needed to better understand the relationship between the level of PA and central obesity. It would be ideal to study how each type, duration, and frequency of PA influence abdominal fat, which would allow us to better understand how to reduce the risk of central obesity. This systematic review indicates a positive influence of PA on central obesity, which is consistent with the results of a systematic review in which PA of all types was reported to be able to reduce WC [56]. .

Central obesity is widely related to metabolic syndrome, an important cardiometabolic risk factor [57-59]. The present review showed a reduction in WC and a reduction in the prevalence of metabolic syndrome through PA. Consistently, Zajac et al., (2017) reported that women with a higher level of PA had an almost four times lower risk of metabolic syndrome compared to less active women [60]. For this reason, it is important to raise awareness and, ideally, educate the population through campaigns on the importance of PA and the negative consequences of a sedentary lifestyle on health. Additionally, due to the complex relationship between PA, body composition, BM, and even nutrients such as vitamin D with central obesity, it is important to highlight that, together with the implementation of health programs and policies at the population level, it is necessary to the involvement of a multidisciplinary team comprised of physicians, nutritionists, and exercise physiologists to improve and successfully treat this condition.

A negative association of central obesity with the components of BM is reported, suggesting a greater risk of metabolic alterations. However, PA interventions demonstrated improvement in these components. It is shown that PA reduces the prevalence of central obesity and, with it, the risk of metabolic syndrome. Central obesity is associated with a higher %BF, suggesting a higher risk of chronic non-communicable diseases. However, PA generated positive changes in WC in participants with central obesity. In individuals with the additional condition of vitamin D deficiency, the predisposition to present a higher %BF seems to be high and the effect of PA on obesity seems to be less efficient. PA seems to be an important factor in the treatment and prevention of central obesity. It is necessary to establish policies that promote PA and the development of a healthy eating environment through different policies that modify the food environment, such as the FoP nutrition warning labels food and nutrition education campaigns; and the prevention of a sedentary lifestyle. It is also advisable to implement a body composition monitoring system as a preventive measure.

One of the strengths of this review lies in the extraction of recent data. This review offers a critical, complete, novel, and relevant view of central obesity and its relationship with PA, body mass, and body composition. It also highlights relevant research questions, for example, regarding the relationship between abdominal adiposity and vitamin D deficiency. Among some limitations, the limited inclusion of studies is acknowledged. Likewise, the different countries and ethnic groups of the participants can be considered as limitations of the study, in addition to age and associated comorbidities. The low representation of studies in developing countries could affect the generalizability of the findings and conclusions. Developing countries have unique characteristics in terms of sociodemographic, cultural, dietary, and health factors. The lack of data in developing countries could be considered as a bias, limiting the external validity of the review as well as a better understanding of the relationship between abdominal obesity, metabolic variables, and PA level in adults. Additionally, the age range was wide, including various age groups such as young adults and older adults, which could generate biases in the study results, due to the known influence of age on body composition. In addition, there were a variety of conditions or diseases associated with central obesity, which could also influence the body composition results. The few studies that have reported data on BM can also be considered a limitation for the present review

In conclusion, a relationship between BM components and central obesity has been proposed. In addition, a direct association was found between central obesity and %BF. PA contributes to the reduction of WC and the prevalence of central obesity. Vitamin D deficiency was found to be a risk factor for central obesity. These findings are useful for the design of policies and programs for the control and prevention of obesity in the adult population.

Acknowledgment

The authors thank the Food and Agriculture Organization of the United Nations in Panama and the School of Nutrition and Dietetics and the Department of Human Physiology of the Faculty of Medicine of the University of Panama for their support in this review.

Authorship Contribution

Author Contributions: VV and DR conceived the main idea; GC, CL, and IRC performed the search and data analysis. GC, CL, FP, IRC, and DR interpreted the results. GC, CL, IRC, and AB wrote the manuscript; FP, VV, DR, IRC, and AB critically reviewed the manuscript. The IRC has final responsibility for all content in this review. All authors critically reviewed this and previous versions of the paper.

Financing

Self-financing by the authors

Funding

Food and Agriculture Organization of the United Nations, Subregional Office for Mesoamerica, Panama City, Panama. Code: TCP/SLM/3902

Conflict of Interests

The authors express that there are no conflicts of interest when writing the manuscript

Disclaimer

The views expressed in this publication are those of the author(s) and do not necessarily reflect the views or policies of the Food and Agriculture Organization of the United Nations

1 World Health Organization. Global Action Plan for the Prevention and Control of NCDs 2013-2020. 2015. p. 1–44.
2 Organización Mundial de la Salud., Organización Mundial de la Salud, WHO. Obesidad y sobrepeso. World Health Organization; 2015 p. 1–4.
3 Rivera E, Fornaris A, Ledesma R, López G, Aguirre Y. Abdominal circumference and risk of cardiovascular disease in Doctor’s Office 22. “Aleida Fernández Chardiet” Polyclinic. 2016. Rev Haban Cienc Méd. 2018;17(4):591–602.
4 Hernandez G, River J, Serrano R, Villalta D, Abbate M, Acosta L, et al. Visceral adiposity,patogheny y measurement. Rev Venez Endocrinol y Metab. 2017;15(2):70–7
5 FAO, FIDA, UNICEF, WFP, WHO. The State of Food Security and Nutrition in the World 2023. Rome; 2023.
6 Blasco R. Basal Metabolic Rate; evaluation methods and applications. Nutr Hosp. 2015;21(1):243–51.
7 Vargas M, Lancheros L, Pilar M. Energy expenditure in repose related to body composition in adults. Rev la Fac Med. 2011;59(1):43–58.
8 Fernández J, Stic H, Mauricio O, Ramos S. Relationship between oxygen consumption, fat percentage and body mass index in college students. Hacia la Promoción la Salud. 2018;23(2):79–89
9 Vásquez VF, Cardona HO, Andrade SM, Salazar RG. Energy balance, body composition and physical activity in eutrophic and obese preschoolers. RevChilPediatr. 2005;76(3):266–74.
10 van Mil EG, Westerterp KR, Kester AD, Saris WH. Energy metabolism in relation to body composition and gender in adolescents. Arch Dis Child. 2001;85(1):73–8.
11 De Figueiredo Ferreira M, Detrano F, Coelho GMDO, Barros ME, Serrão Lanzillotti R, Firmino Nogueira Neto J, et al. Body composition and basal metabolic rate in women with type 2 diabetes mellitus. J Nutr Metab. 2014;2014:7–9.
12 Vandenbroucke JP, Von Elm E, Altman DG, Gøtzsche PC, Mulrow CD, Pocock SJ, et al. Improving Communication of Observational Studies in Epidemiology (STROBE): Explanation and Development. Gac Sanit. 2009;23(2):1–28.
13 Clark HD, Wells GA, Huët C, McAlister FA, Salmi LR, Fergusson D, et al. Assessing the quality of randomized trials: Reliability of the Jadad scale. Control Clin Trials. 1999;20(5):448–52.
14 Martínez, C; Herreros, P; Cobo, J; Carbajal A. Assessment of the nutritional status of a group of adults over 50 years of age using dietary and body composition parameters. Nutr Hosp. 2011;26(5):1081–90.
15 Rahmani A, Hafezi, Mohammadreza Misgavam S, Farhadi F, Vahdat Z. Body Composition and Abdominal Obesity in Patients With and Without Coronary Heart Disease. Cardiol Res. 2014;5(2):68–71.
16 Marbou WJT, Kuete V. Prevalence of metabolic syndrome and its components in Bamboutos division’s adults, West Region of Cameroon. Biomed Res Int. 2019;2019.
17 Lopes E, Bressan J, D Andrea C, Vogel C. Body composition and energy metabolism in women with excess weight. An Sist Sanit Navar. 2010;33(2):155–65.
18 Rocha LM, Baldan DC da S, Souza AL, Chaim EA, Pavin EJ, Alegre SM. Body composition and metabolic profile in adults with vitamin D deficiency. Rev Nutr. 2017;30(4):419–30.
19 Cruz-Rodríguez J, González-Vázquez R, Reyes-Castillo P, Mayorga-Reyes L, Nájera-Medina O, Ramos-Ibáñez N, et al. Ingesta alimentaria y composición corporal asociadas a síndrome metabólico en estudiantes universitarios. Rev Mex Trastor Aliment. 2020;10(1):42–52.
20 Mogre V, Oladele J, Amalba A. Impact of physical activity levels and diet on central obesity among civil servants in Tamale metropolis. J Med Biomed Sci. 2012;1(2):1–9.
21 Mogre V, Nyaba R, Aleyira S. Lifestyle Risk Factors of General and Abdominal Obesity in Students of the School of Medicine and Health Science of the University of Development Studies, Tamale, Ghana. ISRN Obes. 2014;2014:1–10
22 Martínez EG, Gutiérrez AM. Metabolic Syndrome and Body Composition measurements in Blue-Collar Workers from a Metal-Mechanic Factory in Soledad . Preliminary Report. Salud Uninorte Barranquilla. 2017;33(1):1–6.
23 Pantovic A, Zec M, Zekovic M, Obrenovic R, Stankovic S, Glibetic M. Vitamin D Is Inversely Related to Obesity: Cross-Sectional Study in a Small Cohort of Serbian Adults. J Am Coll Nutr. 2019;38(5):405–14.
24 do Nascimento Sales AT, Fregonezi GA de F, Silva AGCB, Ribeiro CTD, Dourado-Junior MET, Sousa AGP, et al. Identification of peripheral arterial disease in diabetic patients and its association with quality of life, physical activity and body composition. J Vasc Bras. 2015;14(1):46–54.
25 Álvarez C, Ramírez-Campillo R, Lucia A, Ramírez-Vélez R, Izquierdo M. Concurrent exercise training on hyperglycemia and comorbidities associated: Non-responders using clinical cutoff points. Scand J Med Sci Sport. 2019;29(7):952–67.
26 Garcia T, Sainz P, Aznar S. Effects of a 20-week pilates method program on body composition. Rev Bras Med do Esporte. 2020;26(2):130–3.
27 Share BL, Naughton GA, Obert P, Peat JK, Aumand E, Kemp JG. Effects of a Multi-Disciplinary Lifestyle Intervention on Cardiometabolic Risk Factors in Young Women with Abdominal Obesity : A Randomised Controlled Trial. PLoS One. 2015;10(6):1–15.
28 Ross R, Hudson R, Stotz PJ, Lam M. Effects of exercise amount and intensity on abdominal obesity and glucose tolerance in obese adults: A randomized trial. Ann Intern Med. 2015;162(5):325–34.
29 Shrivastava U, Fatma M, Mohan S, Singh P, Misra A. Randomized Control Trial for Reduction of Body Weight, Body Fat Patterning, and Cardiometabolic Risk Factors in Overweight Worksite Employees in Delhi, India. J Diabetes Res. 2017;2017:1–12.
30Cowan TE, Brennan AM, Stotz PJ, Clarke J, Lamarche B, Ross R. Separate Effects of Exercise Amount and Intensity on Adipose Tissue and Skeletal Muscle Mass in Adults with Abdominal Obesity. Obesity. 2018;26(11):1697–703.
31 Stensvold D, Tjønna AE, Skaug EA, Aspenes S, Stølen T, Wisløff U, et al. Strength training versus aerobic interval training to modify risk factors of metabolic syndrome. J Appl Physiol. 2010;108(4):804–10.
32Cramer H, Thoms MS, Anheyer D, Lauche R, Dobos G. Yoga bei Frauen mit zentraler Adipositas: Eine randomisierte kontrollierte Studie. Dtsch Arztebl Int. 2016;113(39):645–52.
33 Skrypnik D, Bogdański P, Mądry E, Karolkiewicz J, Ratajczak M, Krys̈ciak J, et al. Effects of Endurance and Endurance Strength Training on Body Composition and Physical Capacity in Women with Abdominal Obesity. Obes Facts. 2015;8(3):175–87.
34Sukala WR, Page R, Lonsdale C, Lys I, Rowlands D, Krebs J, et al. Exercise improves quality of life in indigenous polynesian peoples with type 2 diabetes and visceral obesity. J Phys Act Heal. 2013;10(5):699–707.
35Jyothi R, Nayak B. A Case-Control Study of Dietary Habits, Physical Activity and Risk for Abdominal Obesity Among Working Women. Calicut Med J. 2010;8(2):1–5.
36 Karamzad N, Saghafi-Asl M, Asghari-Jafarabadi M, Naghizadeh M, Amiri P, Mehralizadeh H. Abdominal obesity is a modifier of the association between physical activity and metabolic syndrome: A case-control study. Prog Nutr. 2019;21(4):65–72.
37 Momesso DP, Bussade I, Lima GAB, Fonseca LPC, Russo LAT, Kupfer R. Body composition, metabolic syndrome and insulin resistance in type 1 diabetes mellitus. Arq Bras Endocrinol Metabol. 2011;55(3):189–93.
38 Gremeaux V, Drigny J, Nigam A, Juneau M, Guilbeault V, Latour E, et al. Long-term lifestyle intervention with optimized high- -intensity interval training improves body composition, Cardiometabolic risk, and exercise parameters in patients with abdominal obesity. Am J Phys Med Rehabil. 2012;91(11):941–50.
39 Aspilcueta A. Relationship between body composition, cardiorespiratory fitness and muscular endurance in male Peruvian firefighters. Rev Peuana Cienc la Act física y del Deport. 2021;8(2):1129–38.
40 Kessler HS, Sisson SB, Short KR. The potential for high-intensity interval training to reduce cardiometabolic disease risk. Sport Med. 2012;42(6):489–509.
41 Colombo CM, de Macedo RM, Fernandes-Silva MM, Caporal AM, Stinghen AE, Costantini CR, et al. Short-term effects of moderate intensity physical activity in patients with metabolic syndrome. Einstein (Sao Paulo). 2013;11(3):324–30.
42Kim EJ, Cho SW, Kang JY, Choi TI, Park YK. Effects of a 12-week lifestyle intervention on health outcome and serum adipokines in middle-aged korean men with borderline high blood pressure. J Am Coll Nutr. 2012;31(5):352–60.
43 Rosety-Rodríguez M, Fornieles G, Rosety I, Díaz AJ, Rosety MA, Camacho-Molina A, et al. Central obesity measurements predict metabolic syndrome in a retrospective cohort study of postmenopausal women. Nutr Hosp. 2013;28(6):1912–7.
44 Patiño-Villada FA, Arango-Vélez EF, Quintero-Velásquez MA, Arenas-Sosa MM. Factores de riesgo cardiovascular en una población urbana de Colombia. Rev Salud Publica. 2011;13(3):433–45.
45 Oviedo G, Morón De Salim A, Solano L. Anthropometric indicators of obesity and its relationship with coronary ischemic disease. Nutr Hosp. 2006;21(6):695–8.
46Acosta Cedeño A, Barreto Puebla L-C, Díaz Socorro C, Domínguez Alonso E, Navarro Despaigne D, Cabrera Gámez M, et al. Vitamin D and its relationship with some elements of the metabolic syndrome in middle-aged population. Rev Cuba Endocrinol. 2017;28(2):1–13.
47 Moliné Lana ME, Carías Picón D, Barrios Ospino YB. Vitamina D sérica y su relación con adiposidad y resistencia a la insulina en mujeres posmenopáusicas. Acta Bioquím Clín Latinoam. 2017;51(4):581–92.
48 Tamer G, Mesci B, Tamer I, Kilic D, Arik S. Is vitamin D deficiency an independent risk factor for obesity and abdominal obesity in women? Endokrynol Pol. 2012;63(3):196–201.
49 Júdice PB, Silva AM, Sardinha LB. Sedentary bout durations are associated With abdominal obesity in older adults. J Nutr Health Aging. 2014;2–7.
50 Ramírez R, Agredo RA. El sedentarismo es un factor predictor de hipertrigliceridemia, obesidad central y sobrepeso. Rev Colomb Cardiol. 2012;19(2):75–9.
51 Kay SJ, Fiatarone Singh MA. The influence of physical activity on abdominal fat: A systematic review of the literature. Obes Rev. 2006;7(2):183–200.
52 Ismail I, Keating SE, Baker MK, Johnson NA. A systematic review and meta-analysis of the effect of aerobic vs. resistance exercise training on visceral fat. Obes Rev. 2012;13(1):68–91.
53 Park SK, Park JH, Kwon YC, Kim HS, Yoon MS, Park HT. The effect of combined aerobic and resistance exercise training on abdominal fat in obese middle-aged women. J Physiol Anthropol Appl Human Sci. 2003;22(3):129–35.
54 Slentz CA, Aiken LB, Houmard JA, Bales CW, Johnson JL, Tanner CJ, et al. Inactivity, exercise, and visceral fat. STRRIDE: A randomized, controlled study of exercise intensity and amount. J Appl Physiol. 2005;99(4):1613–8.
55 Ekelund U, Besson H, Luan J, May AM, Sharp SJ, Brage S, et al. Physical activity and gain in abdominal adiposity and body weight: Prospective cohort study in 288,498 men and women. Am J Clin Nutr. 2011;93(4):826–35.
56 Ballin M, Hult A, Björk S, Dinsmore J, Nordström P, Nordström A. Digital exercise interventions for improving measures of central obesity: a systematic review. Int J Public Health. 2020;65(5):593–605.
57 Paley CA, Johnson MI. Abdominal obesity and metabolic syndrome : exercise as medicine ? BMC Sport Sci Med anh Rehabil. 2018;1–8.
58 Coniglio R. Relación entre la obesidad central y los componentes del síndrome metabólico. Acta Bioquímica Clin Lationam. 2014;48(2):191–201.
59Shah R, Murthy V, Abassi S, Blankstein R, Kwong R, Goldfine A, et al. Visceral Adiposity and the Risk of Metabolic Syndrome Across Body Mass Index: The MESA Study. JACC Cardiovasc Imaging. 2014;7(12):1221–35.
60 Zając-Gawlak I, Kłapcińska B, Kroemeke A, Pośpiech D, Pelclová J, Přidalová M. Associations of visceral fat area and physical activity levels with the risk of metabolic syndrome in postmenopausal women. Biogerontology. 2017;18(3):357–66.

Journal of Nutrition and Health Sciences

Tables at a glance
table-icon
Table 1
Figures at a glance
image-icon
Figure 1
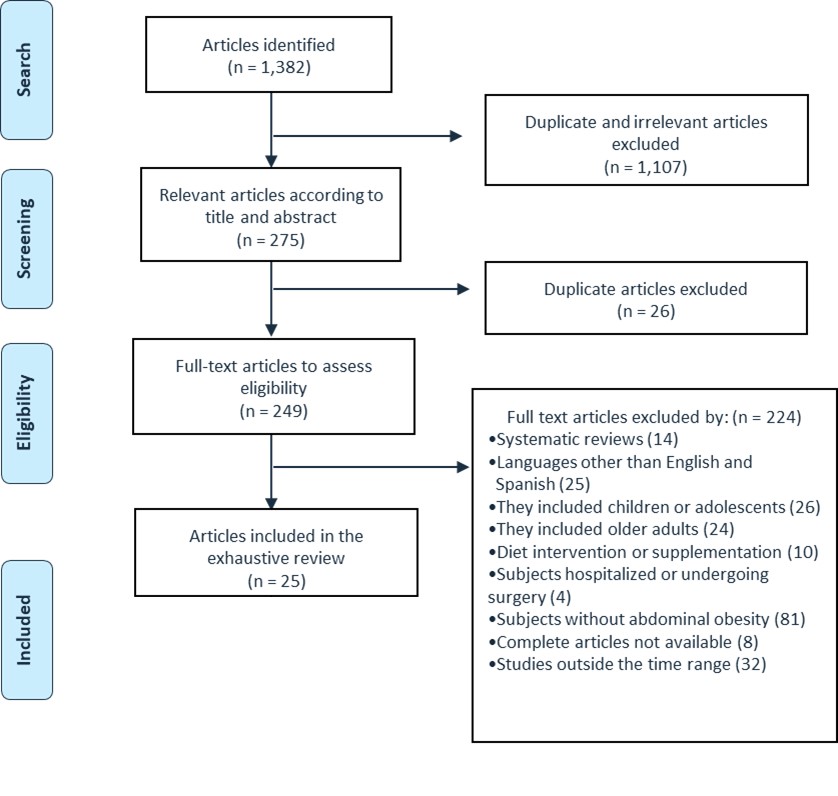
Figure 1: PRISMA Flow Chart

#

Authors                  (year)

study            design

country                of study

Number                                                                                                                                                                        of participants

Sex                          (%)

Age                                                                                                            (years)

Intervention

Duration

metabolic                                                                                                                                                                                                                                                                                                                                             expense

body composition

Physical                                                                                                                                                                                                                                                                                                                                                                                                                                                                                                                                                                                                                                                                                                                           activity

quality              score

1

Jyothi R.               (2010)

case and control

India

340 obese and non-obese

100% M

18-60

First phase: determine the prevalence of abdominal obesity.                                                                                                                                                                                                                                                                                                                                                                   Second phase: compare obesity risk between obese and non-obese.


A significant association between PA and                                                                                                                                                                                                                                                                                                                                                                                                                                                                                                                                                                                                                                           abdominal obesity (OR 0.417, 95% CI 0.180-0.968)

47.10%

2

Karamzad N.           (2019)

case and control

Iran

164 subjects with                                      abdominal obesity

50%H, 50%M

18-60

Application of the IPAQ to classify subjects into low-level AF, moderate-level AF, and high-level AF.                                                                                                                                                                                                                                                                           Evaluation of biochemical and anthropometric parameters.


Half of the cases and controls had PA between high (3000 or more METs)                                                                                                                                                                                                                                                                                                                                                                                                                                                                               and moderate (600-3000 METs), respectively.                                                                                                                                                                                                                                                                                                                                                                                                                                                                                                                                                                                         No significance was found between PA levels and the incidence of metabolic syndrome                                                                                                                                                                                                                                                                                                                                                                                                                                                    (moderate PA [OR 0.69, 95% CI 0.24-1.97];                                                                                                                                                                                                                                                                                                                                                                                                                                                                                                                                                                                                                                                                                                         high PA [OR 1.25, 95% CI 0.44-3.55])

69%

3

Martinez C.            (2011)

cross-section

Spain

49

47%F, 53%F

54.84  ± 4.56

Anthropometric and dietary assessment.                                                                                                                                                                                                                                                                                                                                                                                           BMR estimation by Harris-Benedict and FAO/WHO calculation  


39.1% of men and 26.9% of women had abdominal obesity.                                                                                                                                                                                                                                                                                                                                                                                                                                                                                                               PA was between light and very light (PA for men 1.45 and PA for women 1.40).

22%

4

Rahmania A.         (2014)

cross-section

Iran

161 subjects with or                                      without coronary disease

52%F, 48%F

60.5 ± 18.8

Underwent coronary angiography for stable angina.                                                                                                                                                                                                                                                                                                                                                                       Bioimpedance analysis was performed to measure adipose tissues and MM.


The mean levels of WC and BF were significantly                                                                                                                                                                                                          higher in the group with coronary disease. MM was                                                                                                                                                                                                     also significantly higher in the group without CHD.


47.90%

5

Lopes E.                (2010)

cross-section

Brazil

40 overweight and eutrophic

100% M

Overweight (G1) = 36.62 ± 7.76                                                 Eutrophic (G2) = 35 ± 7.52 years

Anthropometric, dietary, and body composition evaluations were carried out through bioimpedance.                                                                                                                                                                                                                                                                                              PA was evaluated through an accelerometer and energy metabolism through indirect calorimetry.


The women of group 1 presented a BMR of                                                                                                      1488.58 kcal and a WC of 96.78 cm,                                                                                                                                                                                                                                while the women of group 2 showed a                                                                                                               BMR of 1194.71 kcal and a WC of 73.81 cm.


G1 presented higher WC (p<0.05) compared to G2. 38.46% and                                                                                                                                                                                                                                                                                                                                                                                                                                                                                                                                                         50% of women in G1 and G2 respectively were sedentary.                                                                                                                                                                                                                                                                                                                                                                                                                                                                                                       Both groups were classified as sedentary.

28.20%

6

Rocha L.                (2017)

cross-section

Brazil

106

23.6% F, 76.4% F

18-60

They were divided into three groups according to vitamin D levels: deficiency, insufficiency, and sufficiency.                                                                                                                                                                                                                                                              Anthropometric and body composition evaluations were made with bioimpedance and biochemical and clinical evaluations.


The vitamin D deficient group had 41% BF,                                                                                                                                                                                                                                       the deficient group 36%, and those with sufficient vitamin D levels 32%.

High WC was observed in those with vitamin D deficiency.                                                                                                                                                                                                                                                                                                                                                                                                                                                                                                                      However, the prevalence of a sedentary lifestyle was higher in patients with sufficient vitamin D                                                                                                                                                                                                                                                                                                                                                                                                                                                                                                                                                                             (35.8 ± 4.61) abdominal obesity and lower in those with vitamin D deficiency (18.0 ± 2.62).

58.60%

7

Momesso D.         (2011)

control case

Brazil

45 subjects with type 1 diabetes                                                                                                                 mellitus and metabolic syndrome                                                                                                                 or type 1 diabetes mellitus

100% M

36 ± 9

Body composition and insulin resistance were determined by                                                                                                                                                                                                                                                                                                                                                              dual-energy X-ray absorptiometry and eGSR, respectively.


Total body fat and peripheral fat were similar between groups.                                                                                                                                                                           Central fat was negatively correlated with eGSR.

Total body fat and peripheral fat were similar between groups.                                                                                                                                                                                                                                                                                                                                                                                                                                                                                                                                                                          Central fat was negatively correlated with eGSR.

43.20%

8

Alvarez C.             (2019)

Experimental

Chili

89 obese/overweight inactive                                                                                                                  hyperglycemic subjects

100% M

30-59

They were randomly assigned to a TC group or control group.

20 weeks


3.00%

9

Cruz J.                     (2018)

cross-section

Mexico

50

44%F, 56%F

19-25

They completed a questionnaire aimed at evaluating food intake,                                                                                                                                                                                                                                                                                                                                                                                                  in addition, biochemical and body composition parameters were collected.


Regarding the % BF, a high occurrence of overweight (22%)                                                                                                                                                                                        and obesity (38%) was found. Furthermore,                                                                                                                                                                                                             visceral fat increased as WC increased.

Regarding the % BF, a high occurrence of overweight (22%) and obesity (38%) was found.                                                                                                                                                                                                                                                                                                                                                                                                                                                                                                                                                                                                                                                                                                                                                             Furthermore, visceral fat increased as WC increased.

62.20%

10

Garcia T.                (2020)

Experimental

Spain

41

83.3% F, 16.7% F

28-58

They were assigned to an intervention group of a Pilates program of two weekly sessions or a control group.

20 weeks


The intergroup analysis showed significant differences for each of the variables, including WC in pre and post-intervention.

0.00%

11

Share B.                 (2015)

Experimental

Australia

62

100% M

18-30

They were assigned to a PA lifestyle intervention group (2 progressive circuit sessions and one unsupervised session at home),                                                                                                                                                                                                                                                                                                                                   nutritional education, and cognitive-behavioral therapy or a control group.

12 weeks

The intervention group presented an increase in                                                                                                 VO2 max by 4.7 ml kg-1 min-1 or 15%.                                                                                                                                                                                                                   In addition, differences are observed in terms of                                                                                                 total caloric intake which decreased by 1312 kJ or 22%.


There were significant changes in the intervention group before and after WC (-5.8 cm, -6.4%, p=<0.05).                                                                                                                                                                                                                                                                                                                                                                                                                                                                                                                                                                The control group also showed improvements in WC before and after (-5.6cm, -6.2%) Likewise, in AF (+183 min-week, +9.7%).                                                                                                                                                                                                                                                                                                                                                                                                                                                                                                                                        PA was higher after the intervention in the intervention group as opposed to the control group.

3.00%

12

Ross R.                  (2015)

Experimental

Canada

300

65.3% F, 34.7% F

51.4 ± 8.1

They were assigned to a control group or an intervention group with three different programs:                                                                                                                                                                                                                                                                                       exercise of low quantity and intensity (LALI)                                                                                                                                                                                                                                                                                                                                                                                                                                          exercise of high quantity and intensity (HAHI)

24 weeks


The 24-week reductions in WC were significant and greater in LALI (-3.9cm, p=<0.001),                                                                                                                                                                                                                                                                                                                                                                                                                                                                                                                                                                                                                                                                                                                                                                                                                           HALI (-4.6cm, p=<0.001), and HAHI (-4.6, p=<0.001)                                                                                                                                                                                                                                                                                                                                                                                                                                                                                                                                                                                                                                                                                                                                                                   compared with the control group, but did not differ between the intervention groups.

3.00%

13

Sukala W.             (2013)

Experimental

New Zealand

18

72.2% F, 27.8% F

49 ± 5

They were randomly assigned to resistance training or aerobic training 3 times per week.

16 weeks


No association between PA and abdominal obesity was determined.

3.00%

14

Your Birth A.          (2015)

cross-section

Brazil

73

69.8% F, 30.2% F

55.7 ± 11.2

PAD prevalence was assessed using ABI,                                                                                                                                                                                                                                                                                                                                                                                            quality of life was measured using a questionnaire, PA was measured using a modified Baecke questionnaire,                                                                                                                                                                                                                                                                             and body composition was measured using impedance.


Analysis of body composition detected an excess of BF,                                                                                                                                                                                      especially in women, but there was no difference between the groups.

Physical activity did not differ between patients with PAD and those with normal ABI.                                                                                                                                                                                                                                                                                                                                                                                                                                                                                                                                                                                                                                                                                                                                                                       No significant relationship was found between ABI values and PA questionnaire scores.

80%

15

Mogre V.              (2012)

cross-section

Ghana

186

65%H, 35%M

20-59

The dietary pattern was evaluated through food frequency questionnaires and                                                                                                                                                                                                                                                                                                                                  PA was determined through the WHO world levels questionnaire.


10% of the subjects performed physical activity at a high level and 30% at a moderate level, and 60% at a low level.                                                                                                                                                                                                                                                                                                                                                                                                                                                                                                                                                                                                                                                                                                                                             The prevalence of central obesity decreased with AF. Women had a higher risk of central obesity than men.

73.10%

16

Mogre V.              (2014)

cross-section

Ghana

646

445H, 201M

23.06 ± 2.77

Anthropometric measurements were taken.                                                                                                                                                                                                                                                                                                                                                                                              The GPAQ questionnaire was applied to measure the level of PA


The prevalence of abdominal obesity was 4.2%,                                                                                                                                                                                                         being higher in women at 11.9%, compared to men at 0.7%.

In general, 14.7% performed light PA, 48.8% moderate PA, and 36.5% vigorous PA.                                                                                                                                                                                                                                                                                                                                                                                                                                                                                                                                                                                                                                                                                                          Of the 27 students with abdominal obesity, 22.2% performed light PA, 44.4% moderate PA, and 33.3% vigorous PA.                                                                                                                                                                                                                                                                                                                                                                                                                                                                                                                                                                            However, the differences were not significant when stratifying abdominal obesity by PA level.

81.50%

17

Gremeaux V.          (2012)

Cohort

Canada

62 overweight and                                            obese subjects

64.5%H, 35.5%M

53.3 ± 9.7

A program on nutritional counseling, optimized high-intensity interval exercise,                                                                                                                                                                                                                                                                                                                                   and resistance training 2-3 times per week were performed. Anthropometric and cardiometabolic measurements were also made.

9 months


The prevalence of metabolic syndrome was reduced to 32.5% after completing the program (pre= n=37 vs post= n=25).                                                                                                                                                                                                                                                                                                                                                                                                                                                                                                                                                                                                                                                       Thirty-two patients who responded to WC reduction were identified, with a reduction of -5.8 cm or -5.15%

73.50%

18

Martinez E.           (2017)

cross-section

Colombia

236

100% H

30-60

Anthropometric data and biochemical body composition were recorded.                                                                                                                                                                                                                                                                                                                                                The Adult Treatment Panel III criteria were used to define metabolic syndrome.                                                                                                                                                                                                                                                                                                                 Metabolic syndrome components were calculated and correlated with body composition measures.


The WC above 102cm was found in 11.8%.                                                                                                                                                                                                                         BMI and %BF correlated well with waist, blood pressure,                                                                                                                                                                                         fasting blood glucose, and triglycerides.


51%

19

Marbou W.           (2019)

cross-section

Cameroon

604

57.45%H, 42.55%M

43.74 ± 17.21

Interviews, physical, clinical, and biochemical examinations were carried out.                                                                                                                                                                                                                                                                                                                                                                                               The definition of metabolic syndrome of the International Diabetes Federation was used.


He reported that patients with metabolic syndrome are more likely to have high WC compared to normal patients.                                                                                                                                                                                                                                                                                                                                                                                                                                                                                                     A significant relationship was observed between moderate (OR0.65; 95% CI 0.42-0.98) and high (OR 0.30; 95% CI 0.12-0.72) PA and central obesity.

89.20%

20

Shrivastava U.     (2017)

Experimental

India

267 overweight                                              subjects

85.8% H, 14.2% F

22-55

A multicomponent intervention was performed at the intervention sites.                                                                                                                                                                                                                                                                                                                                      They received topics on diet, PA, and healthy living, and 2 sessions were held on each topic.                                                                                                                                                                                                                                                                                                      Topics on stress management and two training sessions were also given.

6 months


There was a decrease in WC in the intervention group (-1.55 cm).                                                                                                                                                                                                                                                                                                                                                                                                                                                                                                                                                                                                                                                                                                                                                                                                                                                                                                                                                                                                                                                                                The sedentary lifestyle was significantly reduced. In the intervention group, more people changed from a sedentary lifestyle to a more active one,                                                                                                                                                                                                                                                                                                                                                                                                                                                                                                                                                 compared to the control group.

3.00%

21

Cowan T.              (2018)

Experimental

Canada

300

60%M, 40%H

52.8 ± 7.6

The subjects were divided into four groups:                                                                                                                                                                                                                                                                                                                                                                                    Control Exercise of high quantity and low intensity (HALI)                                                                                                                                                                                                                                                                                                                                                              High quantity and intensity (HAHI)                                                                                                                                                                                                                                                                                                                                                                                                          Low quantity and intensity (LALI)                                                                                                                                                                                                                                                                                                                                                                                                                                                                               Activities of daily living were measured with an aWCelerometer.

24 weeks

Regarding VO2, there were no differences between the                                                                                    groups that received a                                                                                                                                                                                                                              low amount and low intensity of exercise and                                                                                                     the group that received a low amount and high intensity.


WC was reduced in all exercise groups compared to the control,                                                                                                                                                                                                                                                                                                                                                                                                                                                                                                                                                          but the reduction value did not differ between exercise groups.                                                                                                                                                                                                                                                                                                                                                                                                                                                                                                                                                                                                                                                                                                                                                                                                                                                                                              LALI (-5.1cm), HALI (-6.6cm) and HAHI (-6.2cm)

2.00%

22

Stensvold D.        (2010)

Experimental

Norway

43

60.5%H, 39.5%M

50.9 ± 10.4

They were assigned to one of these four groups:                                                                                                                                                                                                                                                                                                                                                                        Control Aerobic interval training Strength training Combination of AIT (aerobic)                                                                                                                                                                                                                                                                                                                        and ST (strength) Each training was performed 3 times per week.

12 weeks


The control group had an increase in WC while all three intervention groups had a significant decrease:                                                                                                                                                                                                                                                                                                                                                                                                                                                                                                                                                                                                                                                                                                                                                                                                                     AIT (-1.3 cm), COM (-0.74cm), ST (-1.4cm)                                                                                                                                                                                                                                                                                                                                                                                                                                                                                                                                                                             However, only the AIT and ST groups had a significant reduction in WC compared to the control group.

4.00%

23

Cramer H.              (2016)

Experimental

Australia

60

100% M

18-64

They were randomly assigned to a yoga intervention or a control group

12 weeks


Thirteen participants in the yoga group (32.5%) achieved a relevant decrease in WC of less than 5% (-3.7cm)                                                                                                                                                                                                                                                                                                                                                                                                                                                                                                                                                                                                                                                                                                compared to two participants in the control group (10%).

3.00%

24

Skrypnik D.           (2015)

Experimental

Poland

44

50%M, 50%H

18-65

They were randomly assigned to group A (endurance training on cycle ergometers)                                                                                                                                                                                                                                                                                                                                                    or group B (endurance or strength) 3 times per week for 60 min.

3 months


Both groups resulted in a decrease in WC Group A (-5.26cm), and Group B (-7.65cm), without significantly differing values between the groups.

2.00%

25

Pantovic A.          (2019)

cross-section

Serbian

87

60.92% F, 39.08% F

28-56

They were divided according to sex and anthropometric, bioimpedance, and                                                                                                                                                                                                                                                                                                                   biochemical parameters were evaluated.                                                                                                                                                                                                                                                                                                                                                                                                                                             The results were compared according to sex and according to the month of evaluation.

2 months


Most parameters measured by anthropometry                                                                                                                                                                                                                and bioimpedance increased in those adults with                                                                                                                                                                                                       vitamin D deficiency, including %FM and WC.


82.20%

Table 1: Studies included in the systematic review.

Partnered Content Networks

  • Cancer Science
  • Vaccine Studies
  • Gynecology
  • Food Nutrition
  • Nursing Science
  • Public Health
  • The Pharma
  • Infectious Disease
  • Neuro Care
  • Catalysis
  • Neonatal Biology
  • Neonatal Disorders
  • Mutation
  • Nanotechnology
  • Toxicology
  • Dark Biotechnology
  • Pollution Toxicology
  • Cell Biology
  • Bioanalytical Research
  • Renal Disorders
  • The Astrophysics
  • Sleep Physiology
  • Epidemiology
  • Histology