 |
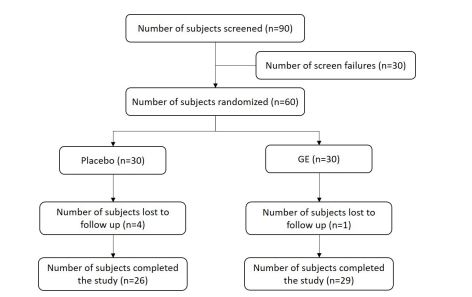
| Figure 1: CONSORT diagram of Ginger Extract (GE) clinical trial. |
|
| Figure 1: CONSORT diagram of Ginger Extract (GE) clinical trial. |
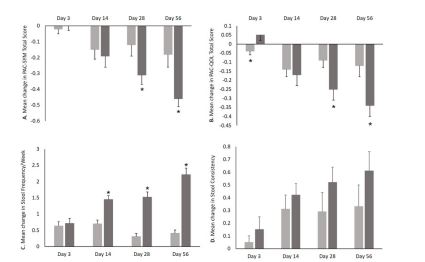 |
| Figure 2: Mean change - (A) Patient Assessment of Constipation Symptoms (PAC-SYM) - Total score; (B) Patient Assessment of Constipa- tion Quality of Life (PAC-QoL) - Total score; (C) Patient Assessment of Stool frequency/Week; (D) Patient Assessment of Bristol Stool Scale Scoring - Stool Consistency. GE - Ginger Extract. |
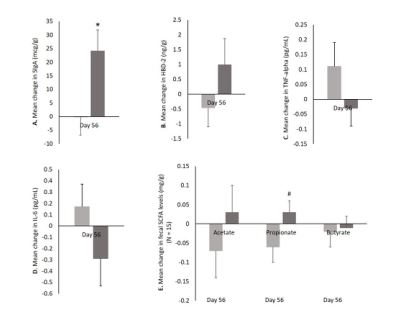 |
| Figure 3: Mean change - (A) Secretory Immunoglobulin A (SIgA) levels (mcg/g) and (B) Human Beta-Defensin 2 (HBD-2) (ng/g) levels in Stool Sample; Inflammatory marker: (C) TNF-alpha (pg/mL) and (D) IL-6 (Interleukin -6 (pg/mL) levels; and (E) SCFAs (Acetate, Propio- nate and Butyrate) (mg/g) levels. GE - Ginger Extract. |
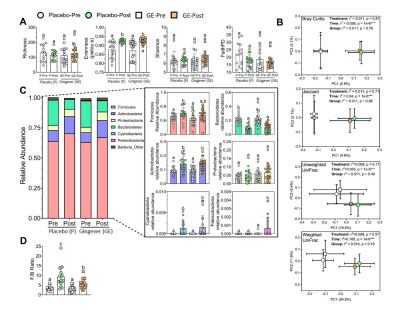 |
| Figure 4: Effect of GE and Placebo on gut microbial composition and diversity. (A) Microbial alpha-diversity of fecal microbial communities in humans fed placebo (n=20 per group; circles) or GE (n=22 per group; squares) for 12 weeks. (B) Beta diversity dissimilarity metrics (Bray Curtis, weighted UniFrac, unweighted UniFrac, and Jaccard) are shown as 2D-principal coordinate analysis (PCoA) plots with the centroid value standard error for each group. The r2 and p values for Supplementation groups (GE/placebo), time (Pre/Post) and overall group ef- fects are displayed on PCoA plots. (C) Relative abundance of ASVs classified by phyla (non-rarified data) after filtering out low abundance (< 0.0005) and low prevalence (< 50%). Different letters (a-c) indicate significant difference as determined by the non-parametric Kruskal-Wallis test for non-normally distributed data or Two-way ANOVA followed by Benjamini, Krieger and Yekutieli multiple compari- sons post-hoc test with FDR-adjustment for parametric data, q< 0.05. (D) F/B ratio: the post-supplementation GE group had a decreased F/B ratio relative to the post- supplementation placebo group. GE - Ginger Extract. |
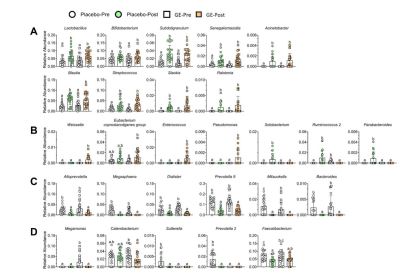 |
| Figure 5: Effect of GE and Placebo on prevalence of specific gut microbes in humans fed placebo (n=20 per group; circles) or GE (n=22 per group; squares) for 12 weeks. (A) Genera elevated in post- supplementation groups; (B) Genera elevated in post- supplementation GE or Placebo; (C) Genera decreased in post- supplementation groups; (D) Genera decreased in either post- supplementation GE or Placebo. Differ- ent letters (a-c) indicate significant difference as determined by the non-parametric Kruskal-Wallis test for non-normally distributed data or Two-way ANOVA followed by Benjamini, Krieger and Yekutieli multiple comparisons post-hoc test with FDR-adjustment for parametric da- ta, q<0.05. GE - Ginger Extract. |
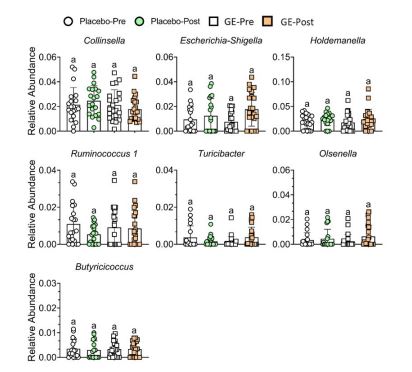 |
| Supplemental Figure 1: Bacterial families and genera unaffected by GE or Placebo in humans fed placebo (n=20 per group; circles) or GE (n=22 per group; squares) for 12 weeks. Relative abundance of ASVs classified by bacterial genera (non-rarified data) after filtration steps. For all panels, data are presented as mean SD. Similar letters indicate no significant difference as determined by the non-parametric Kruskal-Wallis test for non-normally distributed data or Two-way ANOVA followed by Benjamini, Krieger and Yekutieli multiple compari- sons post-hoc test with FDR-adjustment on parametric data, q< 0.05. GE - Ginger Extract |
Parameters |
Placebo (Mean ± SD) |
GE (Mean ± SD) |
N |
30 |
30 |
Age (years) |
36.17 ± 6.24 |
36.30 ± 5.36 |
Male [n (%)] |
29 (48%) |
28 (47%) |
Female [n (%)] |
1 (2%) |
2 (3%) |
2 |
24.84 ± 2.37 |
24.67 ± 2.71 |