 |
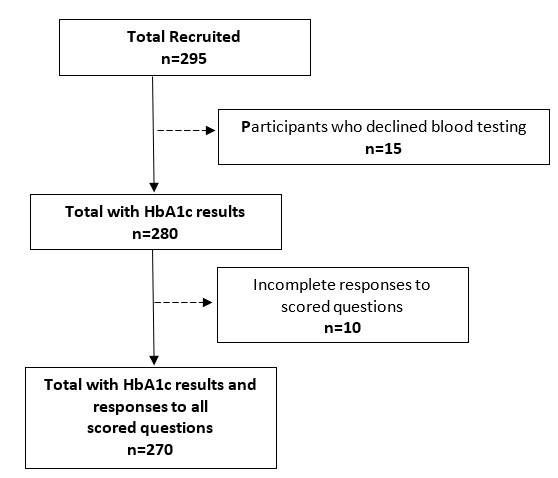
| Figure 1: Participant recruitment and inclusion in the data analyses. |
|
| Figure 1: Participant recruitment and inclusion in the data analyses. |
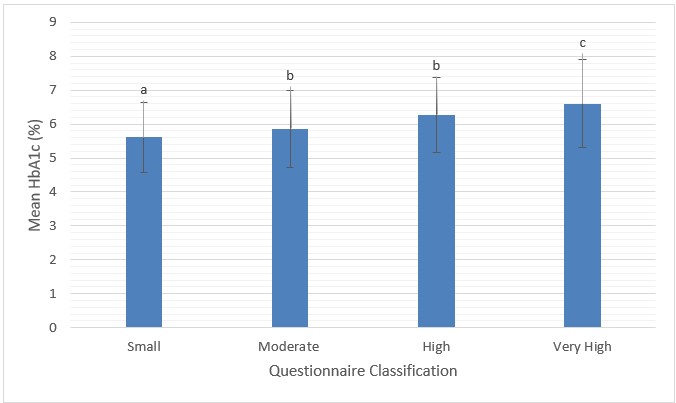 |
| Figure 2: Risk classification based on questionnaire score compared to mean HbA1c (%) a, b and c denote significant differences (p < 0.05) |
Departments |
Selected neighborhoods |
RGPH-IV, 2013* |
Total retained number |
Men sample size |
Women sample size |
Atlantique |
Abomey-Calavi |
121 531 |
56 |
29 |
27 |
Ouidah |
28 572 |
12 |
6 |
6 |
|
Littoral |
Cotonou |
302 221 |
28 |
16 |
12 |
Ouémé |
Porto-Novo |
81 246 |
37 |
18 |
19 |
Akpro-Missreté |
29 363 |
12 |
6 |
6 |
|
Collines |
Savè |
27 467 |
12 |
6 |
6 |
Dassa Zoume |
46 045 |
21 |
10 |
11 |
|
Borgou |
Parakou |
53 820 |
26 |
15 |
11 |
Thaorou |
40 243 |
17 |
10 |
7 |
|
Donga |
Djougou |
68 512 |
32 |
16 |
16 |
Bassila |
29 868 |
13 |
7 |
6 |
|
TOTAL |
266 |
139 |
127 |
||
Questionnaire item |
Response |
Frequency(n) |
Percent (%) |
Sex |
Female<br> |
134<br> |
49.6<br> |
High risk ethnicity |
Yes<br> |
176<br> |
65.2<br> |
High risk birth department |
Yes<br> |
238<br> |
88.1<br> |
Age (years) |
<45<br> |
173<br> |
64.1<br> |
BMI (Kg/m2) |
Normal<br> |
77<br> |
28.5<br> |
Waist circumference |
Low risk<br> |
94<br> |
34.8<br> |
Physical activity at least 3 times a week |
Yes<br> |
127<br> |
47.0<br> |
High blood pressure |
Yes<br> |
150<br> |
55.6<br> |
High blood sugar |
Yes<br> |
18<br> |
6.7<br> |
Family history of diabetes |
Yes<br> |
72<br> |
26.7<br> |
PRE-PAID risk classification |
Small<br> |
106<br> |
39.2<br> |
Descriptive variables |
|
mean |
SD |
PRE-PAID Score |
|
8.45 |
4.06 |
HbA1c (%) |
|
5.88 |
1.16 |
Questionnaire item |
Standardized beta |
t |
P value |
Increasing age category |
0.11 |
2.02 |
0.036 |
Increasing BMI |
0.13 |
2.87 |
<0.001 |
Increasing waist circumference |
0.01 |
0.16 |
0.873 |
Decreasing physical activity participation |
0.12 |
2.64 |
0.009 |
High blood pressure |
0.08 |
1.13 |
0.258 |
High blood sugar |
0.24 |
4.70 |
<0.001 |
Family history of diabetes |
0.07 |
1.61 |
0.108 |