Open Access
Research Article
Max Screen
ISSN: 2393-9060
Copyright: © Halimatou Alaofe. This is an open-access article distributed under the terms of the Creative Commons Attribution License, which permits unrestricted use, distribution, and reproduction in any medium, provided the original author and source are credited.
Related article at Pubmed, Google Scholar
Background & Objectives: With the growing burden of type 2 diabetes (T2D) and associated health, social, and economic costs in sub-Saharan Africa, tools are needed to assess T2D risks rapidly, allowing for targeted early intervention. The objective of this study was to assess the effectiveness of a brief diabetes risk assessment instrument for detecting undiagnosed Type 2 Diabetes among high-risk ethnic communities in Benin, West Africa
Methods: Between October-November 2022, data were collected from 270 adults of 18 years and older in six high-risk diabetes departments of Benin using the Prediabetes Detection and Physical Activity Intervention Delivery (PRE-PAID) risk assessment instrument and assessing hemoglobin A1c (HbA1c). ANOVA and linear regression were used to assess correlation between reported instrument data and HbA1c. We also calculated the PRE-PAID performance regarding sensitivity, specificity, positive predictive value (PPV), negative predictive value (NPV), and area under the receiveroperator curve (AUC) in predicting dysglycemia based on HbA1c ≥ 5.7%
Results: Mean (± SD) HbA1c and PRE-PAID scores were 5.88% ± 1.16 and 8.5 ± 4.1, respectively. Based on the risk assessment instrument results, ANOVA showed that HbA1c significantly increased with increasing risk classification (Welch Statistic 30.45, p < 0.001). Linear regression revealed that previous diagnoses of high blood sugar, BMI, physical activity, and age were significant contributors to the variance in HbA1c (p < 0.05). At a risk score of ≥ 6.5—the threshold for high risk set by the PRE-PAID—had sensitivity 82%, specificity 76%, PPV 55%, NPV 73%, and UAC 0.86.
Conclusions: The PRE-PAID risk assessment instrument showed good performance in identifying prediabetes and T2D in high-risk ethnic communities of Benin, demonstrating that a risk assessment instrument can be an accurate, low-cost, educational, and time-efficient method for assessing T2D risk. Early detection of prediabetes and T2D is critical to increase awareness and prevent complications and their progression
Keywords: Risk assessment tool; glycated hemoglobin (hba1c); prediabetes; diabetes; Benin
The global prevalence of type 2 diabetes (T2D) and prediabetes is increasing, but low- and middle-income countries (LMICs) exhibit the fastest increases [1,2]. In 2010, diabetes alone accounted for 3.96 million deaths among adults worldwide, which increased to 4.20 million in 2019 [3,4]. On the other hand, several high-income countries (HICs) have seen T2D-related mortality decline steadily [5-7]. In contrast, LMICs reported an ongoing trend of T2D, with diabetes mortality increasing from 5.3 deaths per 100,000 in 1990 to 10.9 deaths per 100,000 in 2017 [8]. In addition, the prevalence of T2D is expected to increase by 69% in LMICs by 2030, more than three times the 20% predicted in HICs [9]. Furthermore, undiagnosed diabetes affects 90% of adults aged 20–79 in LMICs, compared to 33% in HICs [10]. Therefore, improving the population's poor health awareness and identifying those at risk is essential [1], thereby reducing the significant delays in diagnosing and treating diabetes and diabetes disability and associated complications common in LMICs [11,12].
Sub-Saharan Africa (SSA), like LMICs, is expected to have the highest percentage increase in T2D incidence, burdening an already underfunded and undertrained healthcare system [13,14]. The International Diabetes Federation (IDF) estimates that 14.2 million people with diabetes in 2015 and 34.2 million by 2040 [15,16]. Benin, a French SSA country, is no exception, as T2D prevalence has increased by 76% over the past seven years, reaching 21.6% in some areas [17]. Many people (49%) remain undiagnosed despite being at risk of T2D [18-20]. Moreover, health services in Benin are primarily curative [21,22]. Prediabetes and T2D are thus rarely diagnosed, leading to cardiovascular disease, retinopathy, or amputations, which the country cannot mitigate. As diabetes-related disabilities increased by 55.8% between 2007 and 2017, diabetes-standard mortality rates reached 618 for women and 430 for men, compared to 190.5 and 122 per 100,000 in the US [23,24]. Therefore, a non-invasive, non-expensive, effective screening tool for T2D in the country, such as the diabetes risk assessment instruments, is needed for early diagnosis, reducing healthcare costs and improving quality of life [25].
Several diabetes risk assessment instruments have been developed and validated worldwide, including the Australian Type 2 Diabetes Risk Assessment Tool [26], the Cambridge Risk Score [27], the Diabetes Algorithm, the Leicester Risk Assessment [28], the American Diabetes Association risk questionnaire, and the Finnish Diabetes Risk Score (FINDRISC) diabetes risk calculator [29]. In a recent systematic review of all current studies on diabetes risk assessment tools used in SSA, the most commonly used non-invasive tools included the Finnish Medical Association risk tool, the World Health Organization (WHO) STEPS instrument, the General Practice Physical Activity Questionnaire (GPPAQ), Rapid Eating and Activity Assessment for Patients (REAP), and an anthropometric tool. The anthropometric predictor variables identified included age, body mass index, waist circumference, positive family of diabetes, and activity levels [30]. However, among the 39 articles that met the inclusion criteria, only three reported tools to diagnose diabetes in symptomatic and asymptomatic patients. In addition, they were developed for Western populations [30], while none have been validated in SSA populations [30]. Therefore, a tool for the rapid identification of diabetes remains to be developed and validated in the region.
Due to the limitations of the existing literature, this study aims to assess the effectiveness of a brief diabetes risk assessment instrument for detecting undiagnosed T2D in high-risk ethnic communities in Benin, West Africa. Although Benin has a high diabetes risk, the only study that evaluated the Finnish Diabetes Risk Score (Findrisc) tool did not perform well [31], indicating that risk questionnaires must be studied in the country's diverse settings and populations. We use the Prediabetes Detection and Physical Activity Intervention Delivery (PRE-PAID) questionnaire as it has been validated on ethnicities such as South Asians,African-Caribbeans, Chinese, and Aboriginals [26], and Benin is known for its multiethnicity populations. The diagnostic test used was the hemoglobin A1c (HbA1c) test, classified according to the 2015 American Diabetes Association (ADA) criteria [32]. Clinicians and public health workers can use the findings of this study to facilitate early detection of T2D among those unaware of their condition, especially in high-risk populations. While this risk assessment instrument does not replace established diagnostic protocols, it can be an accurate, low-cost, educational, and time-efficient method for detecting undiagnosed T2D. In a region that urgently needs to prevent or delay the progression of T2D and its complications, early detection of prediabetes and T2D is crucial.
We conducted a one-month cross-sectional study between October -November 2022 of patients aged 18 years or older living in 6 high-risk diabetes departments of Benin: Atlantique, Littoral, Collines, Borgou, Ouémé, and Donga/Atacora. Selected communities had an elevated prevalence of T2D and a concentration of high-risk ethnicities (15.9%-24.8%). Information on diabetes incidence and prevalence in the different departments of Benin, including population breakdowns, was obtained from the WHO Stepwise Approach to Surveillance (Steps) of Noncommunicable Disease Risk Factors [17].
Study participants in these six departments were selected from urban communes due to their high-risk diabetes factors, such as excessive consumption of highly processed, sweet, and fatty foods [33,34]. They were recruited through community leaders and pre-existing connections within the healthcare centers. With the help of local leaders and health facility staff, the field teams identified the most densely populated areas and a prominent point in the area, e.g., the marketplace, the school, or the health center. This hybrid method has been recommended to balance recruitment efficiency and representativeness [35]. All participants provided written, informed consent before the data collection, and all protocols were approved by the National Ethics Committee for Health Research (NECHR) of Benin and the institutional review boards of the University of Arizona.
Inclusion and Exclusion Criteria: The study was set for adults aged 18 years and older at the time of the survey. We included participants if 1) they were healthy, i.e., without cardiometabolic disorders (hypertension, heart disease, diabetes, or other metabolic disorders), 2) they did not have any condition which would prevent them from having a capillary blood test to assess their glycemic control, 3) they were born in Benin and 4) they had lived in the selected departments for at least one year. We excluded pregnant and lactating women and people with physical or mental disabilities. Sample Size. The estimated sample size was based on a power of 85% and a sampling error of 5%, with a sensitivity of the screening tool of 72% [36], and an estimated diabetes prevalence of 15.1% [17]. The minimum sample size needed is 239, which was increased to 266 to account for potential dropouts (10%).
Random sampling was performed as described in (Table 1). In each department, 2 urban communes (neighborhoods) were chosen randomly, and per neighborhood, households were selected proportional to the density of the population of individuals aged at least 18. In each household, an eligible adult was randomly chosen, male and female alternatively. If there were several eligible persons, a number was assigned to each for the random draw. The participant who wears the number drawn will be the first to be surveyed. The draw was not necessary if the household had only one eligible person.
Data were collected using a pretested interviewer-administered Prediabetes Detection and Physical Activity Intervention Delivery (PRE-PAID) tool questionnaire and collecting capillary blood tests for HbA1c. The PRE-PAID questionnaire focuses on detecting individuals at high risk for developing T2D using a community-based public health approach. The Finnish Diabetes Risk Score (FINDRISC) and Canadian Diabetes Risk Questionnaire (CANRISK) questionnaires provided a detailed and well-established framework upon which the PRE-PAID risk questionnaire was modeled [38]. The mandate of the PRE-PAID instrument was to focus efforts on ethnicities at elevated risk for developing T2D, such as persons of South Asian, African-Caribbean, Chinese, and Aboriginal descent. However, to respond to the context and level of education in Benin, the questionnaire was adapted and translated to French, followed by back translation to English, to ensure the data collection tool’s validity (See Additional file 1 for the adapted PRE-PAID questionnaire)..
Initially, the PRE-PAID tool score is calculated by summing the scores attributed to the variables: age, body mass index, waist circumference, daily physical activity, blood pressure, blood sugar, and family history of diabetes. In the adapted version, we remodeled the questions on daily activity and blood pressure. We also included questions on sex, ethnicity and department of birth because of the high prevalence of T2D in selected departments [17]. Upon completion of the 7 questions, an overall risk score was tabulated, based on a scoring paradigm similar to that of PRE-PAID tool, placing individuals into one of five different risk categories: “Small” (score 0–6), “Moderate” (score 7–11), “High” (score 12–14), “Very High” (score 15–20) and “Extreme” (score over 20). Trained members of the research team assisted study participants with questionnaire completion while anthropometric measurements were taken by trained investigators and point-of-care fingerstick capillary blood and blood pressure by trained phlebotomists. All members of the research team were given three-day training about the data collection procedure and ethical issues. In addition, a pretest was conducted among 10 individuals to assess the content suitability and flow.
Age: Age has been classified into four groups according to PRE-PAID criteria: less than 45 years old=0 point; 45 to 54 years=2 points old=; 55 to 64 years old=3 points.
Body Mass Index (BMI): BMI was calculated using measurements of weight (kg) and height (m). Three groups were set with corresponding PRE-PAID score as followed: BMI <25= 0 points; 25-30 =1 point; > 30 =3 points. .
Waist Circumference (WC): WC was measured using a flexible, unstretched graduated measuring tape with an accuracy of 0.1 cm. The tape was placed midway between the last rib and the iliac crest [39]. The IDF thresholds: 94 cm for men and 80 cm for women were used to detect with abdominal obesity. WC has been classified into three groups as followed: WC < 94 cm for men and WC < 80 cm for women: PRE-PAID score = 0 points; WC = 94-102 cm for men and WC =80-88 cm for women: PRE-PAID score = 3 points; WC > 102cm for men and WC > 88 for women: PRE-PAID score = 4 points.
Daily Physical Activity: Physical exercises data were collected using two groups: 0 points for at least three times per week; and 3 points for rarely or never.
High Blood Pressure (BP): Systolic and diastolic measurements were made using a mercury sphygmomanometer placed on the left arm of each seated participant [40]. Two measurements were taken in 10-minute intervals at rest for at least five minutes. For the same individual, the measurements were taken by the same person. The mean values obtained during both measurements have been used [41]. We used a harmonized definition to define high BP (systolic BP ≥ 130 mmHg or diastolic BP ≥ 85 mmHg). BP has been classified into two groups: 0 points for normal BP and 2 points for high BP
High Blood Sugar: The subjects are classified into three groups: 0 points for subjects with no high blood sugar during health exam; 5 points for subjects with a history of high blood sugar or diabetes or “prediabetes
Family History of Diabetes: The subjects were classified into three groups: 0 points for subjects with no family history of diabetes; 3 points for subjects with a family history of diabetes related to 2nd rank parents (grandparents, uncle, aunt, cousin); 5 points for subjects with a family history of diabetes related to first rank parents (father, mother, brother, sister).
Blood testing: Point-of-care fingerstick capillary blood testing was performed to validate the PRE-PAID tool questionnaire outcomes. HbA1c was selected as the primary blood biomarker because it is a simple, minimally invasive measure that does not require the person to be in a fasted state, thus allowing for flexible testing capabilities. HbA1c is an indicator of three-month glycemic control and is less variable than fasted blood glucose sampling on a day-to-day basis. HbA1c has also been adopted as part of the prediabetes and type 2 diagnostic criteria by the World Health Organization (WHO) and ADA [32,42]. For these reasons, HbA1c is a highly appropriate biomarker for the evaluating the validity of the risk questionnaire.
HbA1c was analyzed using HemoCue® HbA1c 501 System. All capillary blood samples were collected by trained phlebotomists and sterile techniques were utilized in accordance with York University biosafety and ethics requirements. Results of the HbA1c tests were interpreted based on the ADA guidelines diagnostic criteria, which use an HbA1c range of 5.7-6.4% for prediabetes and ≥6.5% for diabetes [32]. Individuals who had HbA1c scores ≥6.5% were provided with a letter describing their results and encouraged to see a primary care physician for further confirmatory testing.
Descriptive statistics as well as frequencies of questionnaire responses were analyzed for all participants who completed the PREPAID questionnaire. Various exclusions within the dataset took place for further analyses based on missing data that was attributable to participant error or data entry error (n=10), or the participant’s unwillingness to provide a blood sample (n=15). (Figure 1) shows the participant flow diagram for the PRE-PAID risk questionnaire administration.
ANOVA with post-hoc pairwise comparisons was performed using Tamhane’s T2 approach, which allows for unequal variances to compare risk classification based on the questionnaire score to mean. Prior to analysis, the “Very High” and “Extreme” groups were merged because of a very small number of participants falling within the “Extreme” classification. From a clinical perspective, individuals within both of the highest risk groups were strongly encouraged to visit a physician for further assessment regardless. In addition to the ANOVA, additional analyses including examination of sensitivity, specificity, positive predictive value [PPV], and negative predictive value [NPV] were performed to examine reliability and validity. These analyses used a cut-point of 6.5 which corresponds to the “moderate” risk category to better describe the ability of the risk questionnaire to predict dysglycemia defined by HbA1c ≥ 5.7%.
Finally, step-wise, backward elimination linear regression was performed to quantify the amount of variance in HbA1c values that was attributable to each of the variables included on the risk questionnaire. All analyses were performed using STATA 17 (StataCorp, College Station, Tex.).
Characteristics of the sample: (Table 2) summarizes the frequency data from the questionnaire responses, and descriptive data for the questionnaire and blood test results.
Questionnaire results: The mean overall risk score for all participants was 8.5 ± 4.1 (SD). About 47% of the respondents reported being physically active 3 or more times per week. In terms of body composition, 37.4% of them were overweight (BMI 25–29), and 34.1% were obese (BMI ≥30). Also, 55.6% of participants had high blood pressure, while only 6.7% reported having been told that they had high blood sugar by a physician. Finally, 27% of participants noted that they had a family history of diabetes, and among these participants, 75% indicated that this was an immediate relative (mother, father, brother, sister, or own child). Based on the overall risk score, 39% of participants fell into the “Small” risk category, 38% into the “Moderate” risk category, 16% into the “High” risk category, 6% into the “Very High” risk category, and 0.4% into the “Extreme” risk category
Blood results: The mean HbA1c was 5.88 ± 1.16% (SD). Overall, 52% of participants had prediabetes (HbA1c range of 5.7-6.4%), and 11% had an HbA1c ≥ 6.5% (ADA diabetes).
Comparison of risk questionnaire and blood outcomes: As shown in (Figure 2), there was a significant increase in mean HbA1c with increasing risk classification based on questionnaire answers (Welch Statistic 30.45, p < 0.001). However, post hoc comparisons using Tamhane’s T2 approach revealed only the “Moderate” and “High” risk groups were not significantly different (p = 0.72) from each other in terms of mean HbA1c. Overall, participants in the “Small” risk category had average HbA1c values (mean HbA1c=5.6%) corresponding to healthy glycemic control, while those in the “Moderate” risk group were in the prediabetes range (mean HbA1c=5.9%). Those in the “High” risk group had corresponding blood test scores with an average HbA1c value in the middle of the ADA prediabetes range (mean HbA1c = 6.2%). Finally, those in the “Very High” risk group had average HbA1c values (Mean HbA1c = 6.6%) in the diabetes range (≥6.5%).
The results of the step-wise, backward elimination linear regression analysis revealed that age category (standardized β = 0.11, p =0.036), BMI (standardized β = 0.13, p < 0.001), physical activity participation (standardized β = 0.12, p=0.009) and previous diagnosis of high blood sugar (standardized β = 0.24, p < 0.001) were all significant contributors to the variance in HbA1c (Table 3). The R2 for this model was 0.365. The area under the receiver-operator curve (AUC) was 0.863 using the definition of dysglycemia as HbA1c ≥5.7%. The sensitivity and specificity using a score of 6.5 as a cut-point were 0.82 and 0.76, respectively. The positive predictive value (PPV) and negative predictive value (NPV) were 0.55 and 0.73, respectively. Finally, through comparison of the participants’ HbA1c value to their response to the question, “have you ever been told by a doctor or nurse that you have high blood sugar?”, 52% of participants with an HbA1c ≥ 5.7% (ADA prediabetes cut point) and 10% with an HbA1c ≥ 6.5% had never been told that they had high blood sugar.
With the increase in frequency and burden of type 2 Diabetes (T2D) in SSA, including Benin, preventing this disease has become a priority in public health. More importantly, a simple, rapid, and laboratory-free screening tool is needed to detect elevated glucose levels before the onset of T2D, even without biochemical analysis. However, in the most recent systematic review of all current studies on diabetes risk assessment tools used in SSA, only three were reported to diagnose diabetes in symptomatic and asymptomatic individuals. At the same time, none have been validated in SSA populations [30]. Our study addresses this gap by adapting a previously developed risk score and validating it in six high-risk communities, and we draw two major conclusions. First, previous diagnoses of high blood sugar, BMI, physical activity, and age contributed significantly to HbA1c variance. Second, the PRE-PAID risk assessment instrument performed well in identifying prediabetes and T2D in high-risk ethnic communities of Benin, demonstrating that a risk assessment instrument can be an accurate, low-cost, educational, and time-efficient method for assessing T2D risk. Our findings not only provide an assessment of diabetes risk but also acts as an important first step in providing awareness and education to elicit healthy behavior changes.
Based on multivariate linear regression analysis of questionnaire outcomes and blood values, previous diagnoses of high blood sugar, body mass index, physical activity participation, and age contributed significantly to HbA1c variability in descending order of standardized beta values. As described previously [43-45], body mass index and physical activity can delay the onset or decrease the risk of prediabetes and T2D. Moreover, obesity (34%) and hypertension (56%) were high among participants. As a result, diet and lifestyle play a significant role in prediabetes development in Benin, thus healthcare professionals should focus on reducing modifiable risk factors. Nonetheless, age has a lower impact on HbA1c levels than other factors, suggesting that patients may be able to reduce their risk of T2D if they adopt adequate lifestyle changes and dietary modifications. Furthermore, contrary to Cederberg et al 2015 [46] and Kyrou et al. 2020 [47], we found that family history is not a significant risk factor for T2D, although people with a family history are more likely to develop the disease. In our study, 73% of the participants had no family history of the disease or were unaware of their family's history. Therefore, more awareness of T2D and understanding of T2D risk factors can help prevent a rise in the prevalence of the disease.
Based on the PRE-PAID scoring threshold, the questionnaire demonstrated reasonable performance in identifying prediabetes and diabetes in the six high-risk communities. Using the risk score of ≥6.5, sensitivity was 82%, specificity 76%, PPV 55%, NPV 73%, and the AUC was 0.86. These results are consistent with those reported by Rowan et al. [38] in a concentrated population of high-risk ethnicities in Canada. In addition, PRE-PAID has higher sensitivity than FINDRISK, used in Benin [31]. We also found higher NPV and PPV, making it reliable and authentic for use beyond the study population. The UAC of 0.86 indicates the reliability and authenticity of the PRE-PAID [48]. Furthermore, high PRE-PAID scores correlate with high HbA1c levels, so the association of PRE-PAID and HbA1c is a strong predictor for the development of prediabetes and T2D. Another finding with substantial clinical significance was the extent to which the screening process identified individuals who were previously unaware of their poor glycemic control. With 52% of people with prediabetes and 10% with diabetes having never been told by a physician or nurse that they had high blood sugar, diabetes and prediabetes screening are imperative.
Currently, there is no screening strategy for undiagnosed T2D in Benin. Most current guidelines on screening for asymptomatic adults for T2D do not recommend routine screening for adults with low-to-moderate risks. The recommendation for adults at high-risk is to screen with fasting plasma glucose every 3 to 5 years, with annual screening for those deemed very high risk [49, 50]. Without a perfect screening method, a trade-off between simplicity and accuracy is always needed. Thus, PRE-PAID can serve as a preliminary screening tool in this population that can be followed by a more invasive and accurate diagnostic test for those at high risk. With this diabetes risk score, many Beninese could gain access to essential information that could help them better understand their diabetes risk. Given the low cost and ease of use, it can also be an accessible health promotion intervention in healthcare centers. Few studies have tested diabetes risk scores to understand if and how individuals change their modifiable diabetes risk factors in response to a high-risk score [51, 52]. Due to the high prevalence of diabetes in working populations in SSA, the workplace is ideal for assessing diabetes risk scores and implementing preventive measures. Finally, researchers should test whether using this score over time helps evaluate the return on investment using the minimally invasive risk score versus more invasive laboratory tests. The results of these studies can provide the evidence needed for investment in diabetes prevention programs in Benin, where health services are primarily curative.
Among the strengths of this study is its ability to reach high-risk communities across the country, as a suitable tool is urgently needed for public health screening initiatives targeting these populations. Due to the exponential rise in T2D prevalence and burden in SSA, reaching those most at risk is crucial, leading to more targeted recruitment. In addition, culturally specific and community-based programs may provide a unique opportunity to screen and intervene with those at greatest risk. Another strength is the use of HbA1c values to define the presence of prediabetes and diabetes. The HbA1c test is recommended for screening dysglycemia, requires no overnight fast, and has the lowest intra-individual variation compared to fasting plasma glucose and oral glucose tolerance tests [53]. Finally, weight, height, waist circumference, and blood pressure were not selfreported since several studies have shown that individuals tend to underreport them [54,55]. However, our study had some limitations. First, this study did not consider hemoglobinopathies associated with altered HBA1c. However, only 4% of the population in Benin is affected by hemoglobinopathies [56,57]. Second, other disease risk factors were not also considered. But, adding additional questions about these risks would make the questionnaire more complex and time-consuming, increasing the burden on the subjects. Third, the small sample size may have contributed to the low prevalence of very high diabetes risk. Finally, the study selected a wide range of age groups. Compared with older adults, young adults may be at risk for different factors and respond differently to those risk factors
The PRE-PAID risk assessment tool showed good performance in identifying prediabetes and T2D in high-risk ethnic communities of Benin, demonstrating that a risk assessment instrument can be an accurate, low-cost, educational, and timeefficient method for assessing T2D risk. Using a simple screening approach involving risk factor identification and HbA1c pointof-care testing, large and diverse population groups become more accessible, and the identification of prediabetes can occur earlier. Given the increasing prevalence of T2D and the economic costs of the disease in SSA, this early detection provides increased awareness and opportunity to individuals allowing them to make important lifestyle changes as quickly as possible with the goal of preventing or delaying the progression toward T2D and associated complications. In particular, most of the risk factors, such as BMI and physical activity, are modifiable risk factors; therefore, dietary and lifestyle modifications can play a crucial role in improving health outcomes for the community. The potential reduction in T2D incidence and prevalence would likely translate into substantial positive implications regarding healthcare resource utilization and the current socio-economic burden attributed to diabetes
The authors wish to thank Weresch, Josephine M for Diabetes Foundation, data collectors, participants, as well as leaders and healthcare professionals from each of the six departments for their assistance and collaboration during the data collection.

![]()

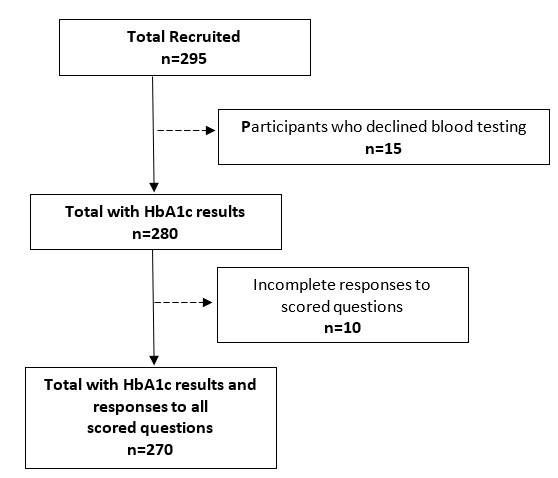 |
| Figure 1: Participant recruitment and inclusion in the data analyses. |
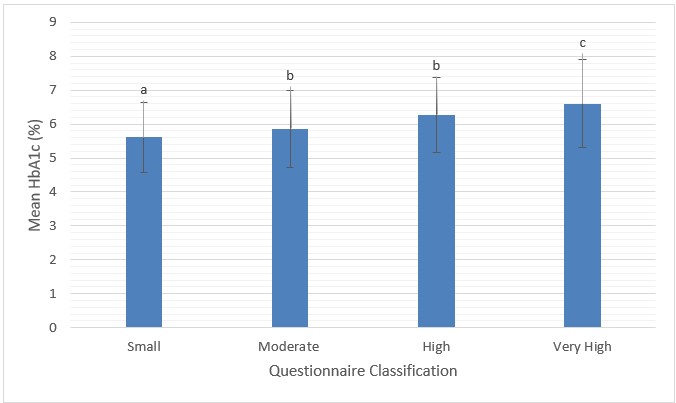 |
| Figure 2: Risk classification based on questionnaire score compared to mean HbA1c (%) a, b and c denote significant differences (p < 0.05) |
Departments |
Selected neighborhoods |
RGPH-IV, 2013* |
Total retained number |
Men sample size |
Women sample size |
Atlantique |
Abomey-Calavi |
121 531 |
56 |
29 |
27 |
Ouidah |
28 572 |
12 |
6 |
6 |
|
Littoral |
Cotonou |
302 221 |
28 |
16 |
12 |
Ouémé |
Porto-Novo |
81 246 |
37 |
18 |
19 |
Akpro-Missreté |
29 363 |
12 |
6 |
6 |
|
Collines |
Savè |
27 467 |
12 |
6 |
6 |
Dassa Zoume |
46 045 |
21 |
10 |
11 |
|
Borgou |
Parakou |
53 820 |
26 |
15 |
11 |
Thaorou |
40 243 |
17 |
10 |
7 |
|
Donga |
Djougou |
68 512 |
32 |
16 |
16 |
Bassila |
29 868 |
13 |
7 |
6 |
|
TOTAL |
266 |
139 |
127 |
||
Questionnaire item |
Response |
Frequency(n) |
Percent (%) |
Sex |
Female<br> |
134<br> |
49.6<br> |
High risk ethnicity |
Yes<br> |
176<br> |
65.2<br> |
High risk birth department |
Yes<br> |
238<br> |
88.1<br> |
Age (years) |
<45<br> |
173<br> |
64.1<br> |
BMI (Kg/m2) |
Normal<br> |
77<br> |
28.5<br> |
Waist circumference |
Low risk<br> |
94<br> |
34.8<br> |
Physical activity at least 3 times a week |
Yes<br> |
127<br> |
47.0<br> |
High blood pressure |
Yes<br> |
150<br> |
55.6<br> |
High blood sugar |
Yes<br> |
18<br> |
6.7<br> |
Family history of diabetes |
Yes<br> |
72<br> |
26.7<br> |
PRE-PAID risk classification |
Small<br> |
106<br> |
39.2<br> |
Descriptive variables |
|
mean |
SD |
PRE-PAID Score |
|
8.45 |
4.06 |
HbA1c (%) |
|
5.88 |
1.16 |
Questionnaire item |
Standardized beta |
t |
P value |
Increasing age category |
0.11 |
2.02 |
0.036 |
Increasing BMI |
0.13 |
2.87 |
<0.001 |
Increasing waist circumference |
0.01 |
0.16 |
0.873 |
Decreasing physical activity participation |
0.12 |
2.64 |
0.009 |
High blood pressure |
0.08 |
1.13 |
0.258 |
High blood sugar |
0.24 |
4.70 |
<0.001 |
Family history of diabetes |
0.07 |
1.61 |
0.108 |


